BMW 2013 Annual Report Download - page 138
Download and view the complete annual report
Please find page 138 of the 2013 BMW annual report below. You can navigate through the pages in the report by either clicking on the pages listed below, or by using the keyword search tool below to find specific information within the annual report.-
 1
1 -
2
-
3
-
4
-
5
-
6
-
7
-
8
-
9
-
10
-
11
-
12
-
13
-
14
-
15
-
16
-
17
-
18
-
19
-
20
-
21
-
22
-
23
-
24
-
25
-
26
-
27
-
28
-
29
-
30
-
31
-
32
-
33
-
34
-
35
-
36
-
37
-
38
-
39
-
40
-
41
-
42
-
43
-
44
-
45
-
46
-
47
-
48
-
49
-
50
-
51
-
52
-
53
-
54
-
55
-
56
-
57
-
58
-
59
-
60
-
61
-
62
-
63
-
64
-
65
-
66
-
67
-
68
-
69
-
70
-
71
-
72
-
73
-
74
-
75
-
76
-
77
-
78
-
79
-
80
-
81
-
82
-
83
-
84
-
85
-
86
-
87
-
88
-
89
-
90
-
91
-
92
-
93
-
94
-
95
-
96
-
97
-
98
-
99
-
100
-
101
-
102
-
103
-
104
-
105
-
106
-
107
-
108
-
109
-
110
-
111
-
112
-
113
-
114
-
115
-
116
-
117
-
118
-
119
-
120
-
121
-
122
-
123
-
124
-
125
-
126
-
127
-
 128
128 -
 129
129 -
 130
130 -
 131
131 -
 132
132 -
 133
133 -
 134
134 -
 135
135 -
 136
136 -
 137
137 -
 138
138 -
 139
139 -
 140
140 -
 141
141 -
 142
142 -
 143
143 -
 144
144 -
 145
145 -
 146
146 -
 147
147 -
 148
148 -
149
-
150
-
151
-
152
-
153
-
154
-
155
-
156
-
157
-
158
-
159
-
160
-
161
-
162
-
163
-
164
-
165
-
166
-
167
-
168
-
169
-
170
-
171
-
172
-
173
-
174
-
175
-
176
-
177
-
178
-
179
-
180
-
181
-
182
-
183
-
184
-
185
-
186
-
187
-
188
-
189
-
190
-
191
-
192
-
193
-
194
-
195
-
196
-
197
-
198
-
199
-
200
-
201
-
202
-
203
-
204
-
205
-
206
-
207
-
208
 |
 |

138
88 GROUP FINANCIAL STATEMENTS
88 Income Statements
88 Statement of
Comprehensive Income
90 Balance Sheets
92 Cash Flow Statements
94 Group Statement of Changes in
Equity
96 Notes
96 Accounting Principles and
Policies
114 Notes to the Income Statement
121 Notes to the Statement
of Comprehensive Income
122
Notes to the Balance Sheet
145 Other Disclosures
161 Segment Information
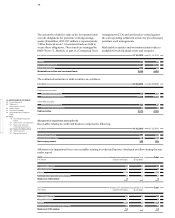
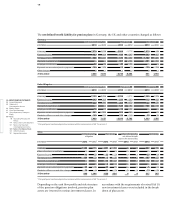
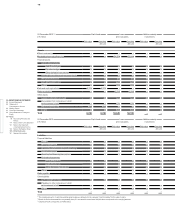
The net defined benefit liability for pension plans in Germany, the UK and other countries changed as follows:
Germany
Defined benefit obligation Plan assets Net liability
in € million 2013 2012 2013 2012 2013 2012
1 January 7,974 5,618 – 6,064 – 5,178 1,910 440
Expense / income 483 414 – 183 – 247 300 167
Remeasurements – 946 2,046 – 174 – 466 – 1,120 1,580
Payments to external funds – – – 301 – 153 – 301 – 153
Employee contributions 42 39 – 42 – 39 – –
Payments on account and pension payments – 154 – 143 15 19 – 139 – 124
Other changes 1 – – – 1 –
31 December 7,400 7,974 – 6,749 – 6,064 651 1,910
United Kingdom
Defined benefit obligation Plan assets Net liability
in € million 2013 2012* 2013 2012 2013 2012*
1 January 7,137 6,499 – 5,782 – 5,376 1,355 1,123
Expense / income 345 368 – 233 – 260 112 108
Remeasurements 330 346 – 305 – 170 25 176
Payments to external funds – – – 135 – 93 – 135 – 93
Employee contributions 18 17 – 18 – 17 – –
Payments on account and pension payments – 261 – 269 269 280 8 11
Translation differences and other changes – 160 176 128 – 146 – 32 30
31 December 7,409 7,137 – 6,076 – 5,782 1,333 1,355
* Prior year figures have been adjusted in accordance with the revised version of IAS 19, see note 7.
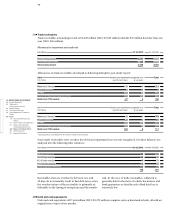
Other
Defined benefit Plan assets Effect of limiting the Net liability
obligation net defined benefit
asset to the asset ceiling
in € million 2013 2012* 2013 2012* 2013 2012 2013 2012*
1 January 1,144 913 – 601 – 484 4 3 547 432
Effect of first-time consolidation – 2 – – – – – 2
Expense / income 48 85 – 22 – 21 – – 26 64
Remeasurements – 164 170 – 2 – 35 1 2 – 165 137
Payments to external funds – – – 73 – 67 – – – 73 – 67
Employee contributions 4 4 – 4 – 4 – – – –
Payments on account and pension payments – 45 – 22 40 21 – – – 5 – 1
Translation differences and other changes – 38 – 8 26 – 11 – 1 – 1 – 13 – 20
31 December 949 1.144 – 636 – 601 4 4 317 547
* Prior year figures have been adjusted in accordance with the revised version of IAS 19, see note 7.
accordance with the requirements of revised IAS 19,
new investment classes were included in the break-
down of plan assets.
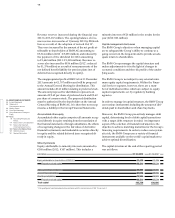
Depending on the cash flow profile and risk structure
of the pension obligations involved, pension plan
assets are invested in various investment classes. In