BMW 2013 Annual Report Download - page 125
Download and view the complete annual report
Please find page 125 of the 2013 BMW annual report below. You can navigate through the pages in the report by either clicking on the pages listed below, or by using the keyword search tool below to find specific information within the annual report.-
 1
1 -
2
-
3
-
4
-
5
-
6
-
7
-
8
-
9
-
10
-
11
-
12
-
13
-
14
-
15
-
16
-
17
-
18
-
19
-
20
-
21
-
22
-
23
-
24
-
25
-
26
-
27
-
28
-
29
-
30
-
31
-
32
-
33
-
34
-
35
-
36
-
37
-
38
-
39
-
40
-
41
-
42
-
43
-
44
-
45
-
46
-
47
-
48
-
49
-
50
-
51
-
52
-
53
-
54
-
55
-
56
-
57
-
58
-
59
-
60
-
61
-
62
-
63
-
64
-
65
-
66
-
67
-
68
-
69
-
70
-
71
-
72
-
73
-
74
-
75
-
76
-
77
-
78
-
79
-
80
-
81
-
82
-
83
-
84
-
85
-
86
-
87
-
88
-
89
-
90
-
91
-
92
-
93
-
94
-
95
-
96
-
97
-
98
-
99
-
100
-
101
-
102
-
103
-
104
-
105
-
106
-
107
-
108
-
109
-
110
-
111
-
112
-
113
-
114
-
 115
115 -
 116
116 -
 117
117 -
 118
118 -
 119
119 -
 120
120 -
 121
121 -
 122
122 -
 123
123 -
 124
124 -
 125
125 -
 126
126 -
 127
127 -
 128
128 -
 129
129 -
 130
130 -
 131
131 -
 132
132 -
 133
133 -
 134
134 -
 135
135 -
136
-
137
-
138
-
139
-
140
-
141
-
142
-
143
-
144
-
145
-
146
-
147
-
148
-
149
-
150
-
151
-
152
-
153
-
154
-
155
-
156
-
157
-
158
-
159
-
160
-
161
-
162
-
163
-
164
-
165
-
166
-
167
-
168
-
169
-
170
-
171
-
172
-
173
-
174
-
175
-
176
-
177
-
178
-
179
-
180
-
181
-
182
-
183
-
184
-
185
-
186
-
187
-
188
-
189
-
190
-
191
-
192
-
193
-
194
-
195
-
196
-
197
-
198
-
199
-
200
-
201
-
202
-
203
-
204
-
205
-
206
-
207
-
208
 |
 |
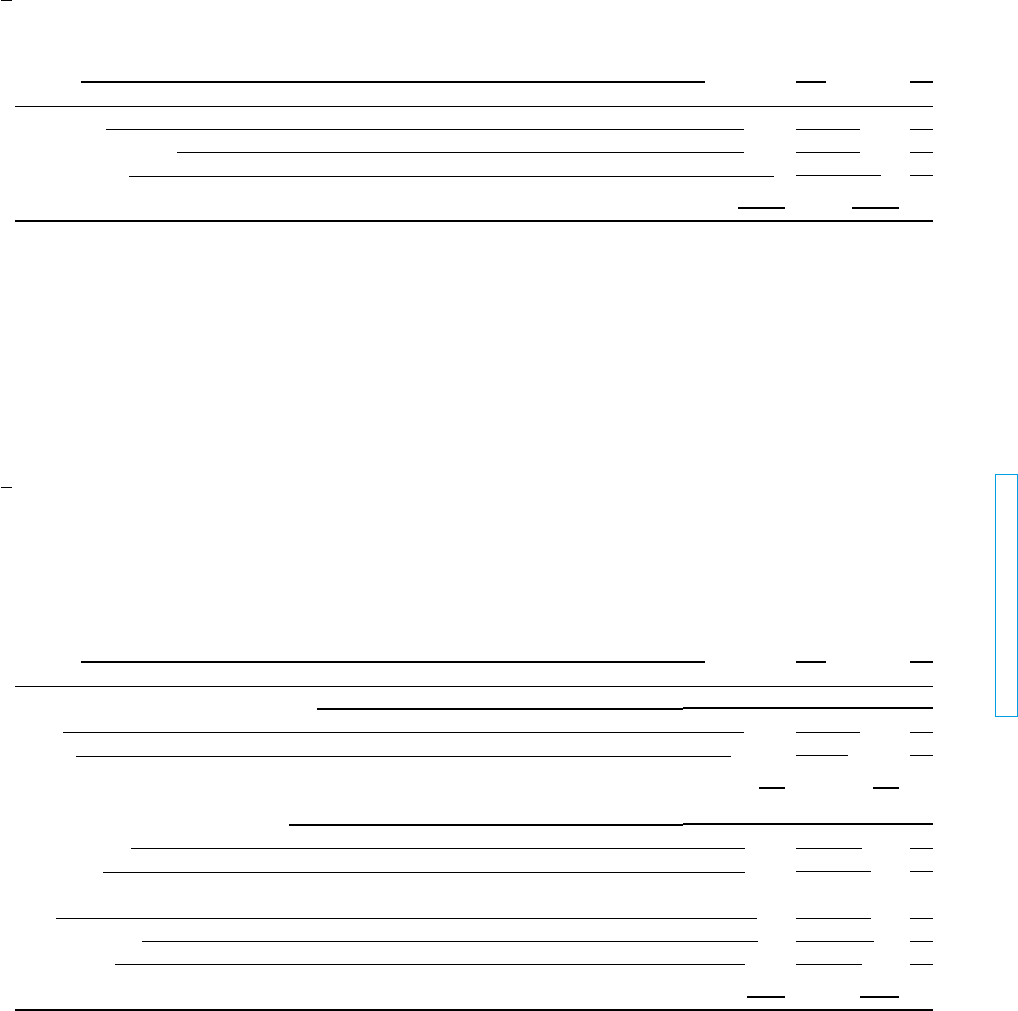
125 GROUP FINANCIAL STATEMENTS
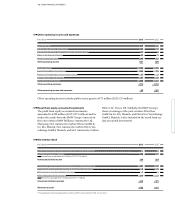
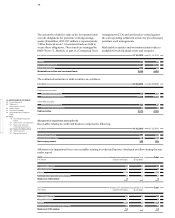
in € million 31. 12. 2013 31. 12. 2012
within one year 6,314 6,215
between one and five years 6,587 6,570
later than five years 5 12
Minimum lease payments 12,906 12,797
24
25
Leased products
The BMW Group, as lessor, leases out its own products
and those of other manufacturers as part of its finan-
cial
services business. Minimum lease payments of
€ 12,906 million (2012: € 12,797 million) from non-can-
cellable operating leases fall due as follows:
Contingent rents of € 171 million (2012: € 166 million),
based principally on the distance driven, were recog-
nised in income. Some of the agreements contain price
adjustment clauses as well as extension and purchase
options.
Impairment losses recognised on leased products to-
talled € 139 million.
Based on data collated at local level for each individual
contract, the historical acquisition / manufacturing
costs of leased assets and historical depreciation
thereon were adjusted, without any impact on carry-
ing amounts.
An analysis of changes in leased products is provided
in
note 21.
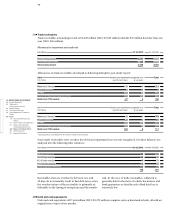
Investments accounted for using the equity method
and other investments
Investments accounted for using the equity method
comprise the Group’s investments in the joint ventures
BMW Brilliance Automotive Ltd., Shenyang, SGL
Automotive Carbon Fibers GmbH & Co. KG, Munich,
SGL
Automotive Carbon Fibers Verwaltungs GmbH,
Munich,
SGL Automotive Carbon Fibers LLC, Dover,
DE, DriveNow GmbH & Co. KG, Munich, and DriveNow
Verwaltungs GmbH, Munich.
The Group’s share of results of joint ventures and its
accumulated interest in investments accounted for using
the equity method are as follows:
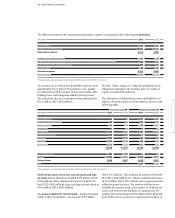
in € million 31. 12. 2013 31. 12. 2012
Disclosures relating to the income statement
Income 4,531 3,516
Expenses – 4,133 – 3,245
Profit 398 271
Disclosures relating to the balance sheet
Non-current assets 1,426 1,018
Current assets 1,389 991
Equity 951 663
Non-current liabilities 169 117
Current liabilities 1,695 1,229
Balance sheet total 2,815 2,009
Capital commitments to the joint ventures SGL Auto-
motive Carbon Fibers GmbH & Co. KG, Munich, and
SGL Automotive Carbon Fibers LLC, Dover, DE, at
the end of the reporting period totalled € 139 million
(2012: € 95 million).
Other investments relate to investments in non-
con-
solidated subsidiaries, interests in associated companies
not accounted for using the equity method, participa-
tions and non-current marketable securities.