BMW 2013 Annual Report Download - page 50
Download and view the complete annual report
Please find page 50 of the 2013 BMW annual report below. You can navigate through the pages in the report by either clicking on the pages listed below, or by using the keyword search tool below to find specific information within the annual report.-
 1
1 -
2
-
3
-
4
-
5
-
6
-
7
-
8
-
9
-
10
-
11
-
12
-
13
-
14
-
15
-
16
-
17
-
18
-
19
-
20
-
21
-
22
-
23
-
24
-
25
-
26
-
27
-
28
-
29
-
30
-
31
-
32
-
33
-
34
-
35
-
36
-
37
-
38
-
39
-
 40
40 -
 41
41 -
 42
42 -
 43
43 -
 44
44 -
 45
45 -
 46
46 -
 47
47 -
 48
48 -
 49
49 -
 50
50 -
 51
51 -
 52
52 -
 53
53 -
 54
54 -
 55
55 -
 56
56 -
 57
57 -
 58
58 -
 59
59 -
 60
60 -
61
-
62
-
63
-
64
-
65
-
66
-
67
-
68
-
69
-
70
-
71
-
72
-
73
-
74
-
75
-
76
-
77
-
78
-
79
-
80
-
81
-
82
-
83
-
84
-
85
-
86
-
87
-
88
-
89
-
90
-
91
-
92
-
93
-
94
-
95
-
96
-
97
-
98
-
99
-
100
-
101
-
102
-
103
-
104
-
105
-
106
-
107
-
108
-
109
-
110
-
111
-
112
-
113
-
114
-
115
-
116
-
117
-
118
-
119
-
120
-
121
-
122
-
123
-
124
-
125
-
126
-
127
-
128
-
129
-
130
-
131
-
132
-
133
-
134
-
135
-
136
-
137
-
138
-
139
-
140
-
141
-
142
-
143
-
144
-
145
-
146
-
147
-
148
-
149
-
150
-
151
-
152
-
153
-
154
-
155
-
156
-
157
-
158
-
159
-
160
-
161
-
162
-
163
-
164
-
165
-
166
-
167
-
168
-
169
-
170
-
171
-
172
-
173
-
174
-
175
-
176
-
177
-
178
-
179
-
180
-
181
-
182
-
183
-
184
-
185
-
186
-
187
-
188
-
189
-
190
-
191
-
192
-
193
-
194
-
195
-
196
-
197
-
198
-
199
-
200
-
201
-
202
-
203
-
204
-
205
-
206
-
207
-
208
 |
 |
50
18 COMBINED MANAGEMENT REPORT
18
General Information on the BMW Group
18 Business Model
20 Management System
23 Research and Development
24 Report on Economic Position
24 Overall Assessment by Management
24 General and Sector-specific
Environment
27
Financial and Non-financial
Performance Indicators
29 Review of Operations
47 Results of Operations, Financial
Position and Net Assets
62 Events after the End of the
Reporting Period
63 Report on Outlook, Risks and
Opportunities
63 Outlook
68 Risks Report
77 Report on Opportunities
81 Internal Control System and Risk
Management System Relevant for
the
Consolidated Financial Reporting Process
82 Disclosures Relevant for Takeovers
and Explanatory Comments
85
BMW Stock and Capital Markets
A profit before tax of € 164 million (2012: € 3 million) was
recorded for the Other Entities segment. The positive
impact of market value changes of interest rate deriva-
tives,
recorded in other financial result, was the main
reason for the improvement.
The negative impact on earnings at the level of profit be-
fore tax reported in the Eliminations column decreased
from € 937 million in 2012 to € 527 million in 2013,
mainly due to lower inter-segment eliminations. This
line item in the Eliminations column also includes a
positive exceptional impact of € 129 million, resulting
from fine-tuning the methodology used to measure
leased products.
Financial position
The consolidated cash flow statements for the Group
and the Automotive and Financial Services segments
show the sources and applications of cash flows for the
financial years 2013 and 2012, classified into cash
flows
from operating, investing and financing activities.
Cash and cash equivalents in the cash flow statements
correspond to the amount disclosed in the balance
sheet.
Cash flows from operating activities are determined
indirectly, starting with Group and segment net profit.
By contrast, cash flows from investing and financial
activities are based on actual payments and receipts.
The cash inflow from operating activities in 2013
decreased by € 1,462 million to € 3,614 million (2012:
€ 5,076 million), mainly due to rises in leased prod-
ucts
and receivables from sales financing totalling
€ 6,549 million (2012: € 5,409 million) brought about
by sales volume factors.
The cash outflow for investing activities amounted to
€ 6,981 million (2012: € 5,433 million) and was thus
28.5 % higher than in the previous year. The increase
primarily reflects investments in property, plant and
equipment and intangible assets which went up by
€ 1,433 million to € 6,669 million. Net investments in
marketable securities resulted in a cash outflow of
€ 381 million (2012: € 175 million).
Further information on investments is provided in the
section on the net assets position.
Cash inflow from financing activities totalled € 2,703 mil-
lion
(2012: € 952 million). Proceeds from the issue of
bonds amounted to € 8,982 million (2012: € 7,977
mil-
lion), compared with an outflow of € 7,242 million (2012:
€ 6,727 million) for the repayment of bonds. Non-cur-
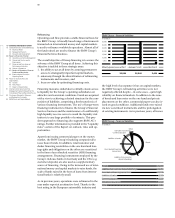
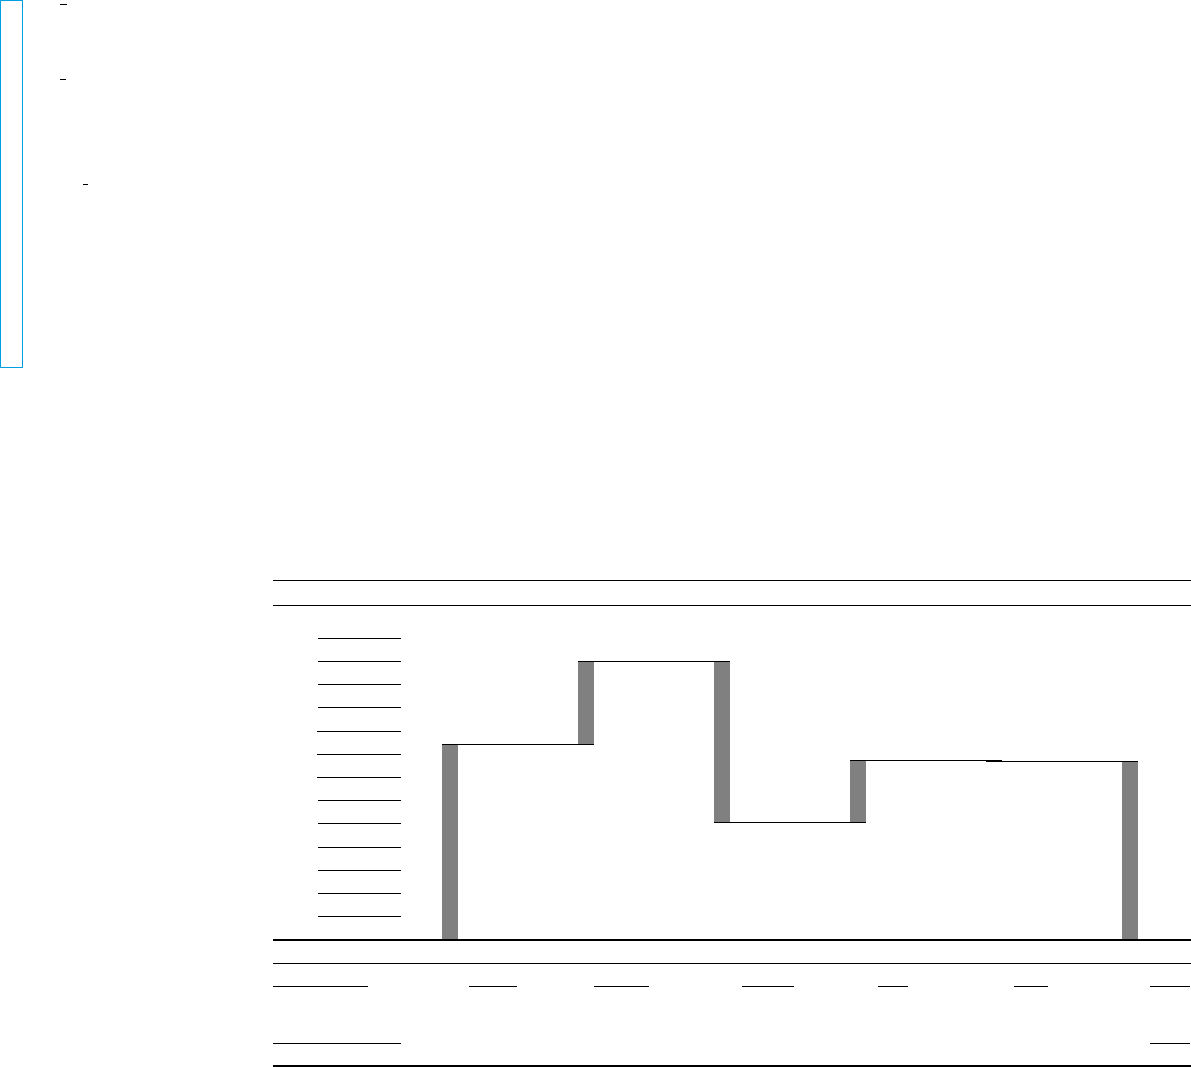
Change in cash and cash equivalents
in € million
13,000
12,000
11,000
10,000
9,000
8,000
7,000
6,000
5,000
4,000
3,000
2,000
1,000
Cash and cash Cash inflow Cash outflow Cash inflow Currency trans- Cash and cash
equivalents from operating from investing from financing lation, changes in equivalents
31.12. 2012 activities activities activities Group composition 31.12. 2013
8,370 + 3,614 – 6,981 + 2,703 – 42 7,664