BMW 2013 Annual Report Download - page 49
Download and view the complete annual report
Please find page 49 of the 2013 BMW annual report below. You can navigate through the pages in the report by either clicking on the pages listed below, or by using the keyword search tool below to find specific information within the annual report.-
 1
1 -
2
-
3
-
4
-
5
-
6
-
7
-
8
-
9
-
10
-
11
-
12
-
13
-
14
-
15
-
16
-
17
-
18
-
19
-
20
-
21
-
22
-
23
-
24
-
25
-
26
-
27
-
28
-
29
-
30
-
31
-
32
-
33
-
34
-
35
-
36
-
37
-
38
-
 39
39 -
 40
40 -
 41
41 -
 42
42 -
 43
43 -
 44
44 -
 45
45 -
 46
46 -
 47
47 -
 48
48 -
 49
49 -
 50
50 -
 51
51 -
 52
52 -
 53
53 -
 54
54 -
 55
55 -
 56
56 -
 57
57 -
 58
58 -
 59
59 -
60
-
61
-
62
-
63
-
64
-
65
-
66
-
67
-
68
-
69
-
70
-
71
-
72
-
73
-
74
-
75
-
76
-
77
-
78
-
79
-
80
-
81
-
82
-
83
-
84
-
85
-
86
-
87
-
88
-
89
-
90
-
91
-
92
-
93
-
94
-
95
-
96
-
97
-
98
-
99
-
100
-
101
-
102
-
103
-
104
-
105
-
106
-
107
-
108
-
109
-
110
-
111
-
112
-
113
-
114
-
115
-
116
-
117
-
118
-
119
-
120
-
121
-
122
-
123
-
124
-
125
-
126
-
127
-
128
-
129
-
130
-
131
-
132
-
133
-
134
-
135
-
136
-
137
-
138
-
139
-
140
-
141
-
142
-
143
-
144
-
145
-
146
-
147
-
148
-
149
-
150
-
151
-
152
-
153
-
154
-
155
-
156
-
157
-
158
-
159
-
160
-
161
-
162
-
163
-
164
-
165
-
166
-
167
-
168
-
169
-
170
-
171
-
172
-
173
-
174
-
175
-
176
-
177
-
178
-
179
-
180
-
181
-
182
-
183
-
184
-
185
-
186
-
187
-
188
-
189
-
190
-
191
-
192
-
193
-
194
-
195
-
196
-
197
-
198
-
199
-
200
-
201
-
202
-
203
-
204
-
205
-
206
-
207
-
208
 |
 |

49 COMBINED MANAGEMENT REPORT
Earnings performance by segment
Revenues of the Automotive segment increased by 0.6 %
to € 70,629 million. The benefits of higher sales volume
figures were held down by the negative impact of the
depreciation in value of a number of major currencies
(including the US dollar and the Japanese yen). Adjusted
for exchange rate factors, segment revenues rose by
3.5 %. At 18.2 %, gross profit margin was down on the pre-
vious
year’s high level of 19.5 %.
Selling and administrative expenses went up by
€ 250
million to € 6,112 million compared to the pre-
vious year, with the rise in administrative expenses
mainly attributable to the higher workforce size and
to group-wide IT restructuring. Segment selling
and administrative expenses were equivalent to 8.7 %
(2012: 8.3 %) of revenues.
The net expense from other operating income and ex-
penses improved by € 133 million (2012: net expense
of
€ 222 million), helped by positive foreign currency
translation effects in 2013 and the fact that the previous
year’s figure had included negative first-time consoli-
dation
effects.
The profit before financial result (EBIT) amounted to
€ 6,657 million (2012: € 7,599 million), giving an EBIT
margin of 9.4 % (2012: 10.8 %).
The segment financial result was a net expense of
€ 96 million, an improvement of € 333 million over
the
previous year. The result from equity accounted invest-
ments,
which improved by € 127 million, comprised
the segment’s share of results from interests in the joint
venture BMW Brilliance Automotive Ltd., Shenyang,
the joint ventures with the SGL Carbon Group, and the
two DriveNow entities. Favourable changes in market
prices of commodity derivatives had a positive impact
on other financial result. Compared to the previous year,
write-downs on available-for-sale marketable securities
had a lower impact on the financial result.
Overall, the segment profit before tax amounted to
€ 6,561 million (2012: € 7,170 million) and the effective
tax rate was 32.8 % (2012: 34.2 %).
In the Motorcycles segment, the number of BMW brand
motorcycles handed over to customers increased by
8.3 %, while segment revenues edged up by 0.9 %. Ad-
justed
for exchange rate factors, segment revenues rose
by 4.4 %.
The pre-tax segment result improved by € 70 million
(2012: € 6 million). The previous year’s figure was nega-
tively impacted by one-time losses recognised in con-
junction with the planned sale of the Husqvarna Group.
Financial Services segment revenues increased by 1.7 %
to € 19,874 million. Adjusted for exchange rate factors,
revenues increased by 4.0 %. The segment’s performance
reflects the growth in the contract portfolio. The gross
profit margin remained at the previous year’s level of
13.1 %. Selling and administrative expenses went down
slightly. The net amount of other operating income
and expenses improved by € 20 million. Overall the
Financial Services segment reports a profit before tax of
€ 1,639 million, 5.0 % up on the previous year’s figure of
€ 1,561 million.
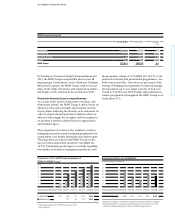
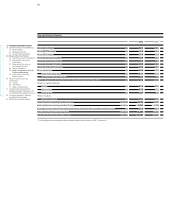
Revenues by segment
in € million
2013 2012
Automotive 70,629 70,208
Motorcycles 1,504 1,490
Financial Services 19,874 19,550
Other Entities 6 5
Eliminations – 15,955 – 14,405
Group 76,058 76,848
Profit / loss before tax by segment
in € million
2013 2012
Automotive 6,561 7,170
Motorcycles 76 6
Financial Services 1,639 1,561
Other Entities 164 3
Eliminations – 527 – 937
Group 7,913 7,803