BMW 2013 Annual Report Download - page 4
Download and view the complete annual report
Please find page 4 of the 2013 BMW annual report below. You can navigate through the pages in the report by either clicking on the pages listed below, or by using the keyword search tool below to find specific information within the annual report.-
 1
1 -
 2
2 -
 3
3 -
 4
4 -
 5
5 -
 6
6 -
 7
7 -
 8
8 -
 9
9 -
 10
10 -
 11
11 -
 12
12 -
 13
13 -
 14
14 -
 15
15 -
16
-
17
-
18
-
19
-
20
-
21
-
22
-
23
-
24
-
25
-
26
-
27
-
28
-
29
-
30
-
31
-
32
-
33
-
34
-
35
-
36
-
37
-
38
-
39
-
40
-
41
-
42
-
43
-
44
-
45
-
46
-
47
-
48
-
49
-
50
-
51
-
52
-
53
-
54
-
55
-
56
-
57
-
58
-
59
-
60
-
61
-
62
-
63
-
64
-
65
-
66
-
67
-
68
-
69
-
70
-
71
-
72
-
73
-
74
-
75
-
76
-
77
-
78
-
79
-
80
-
81
-
82
-
83
-
84
-
85
-
86
-
87
-
88
-
89
-
90
-
91
-
92
-
93
-
94
-
95
-
96
-
97
-
98
-
99
-
100
-
101
-
102
-
103
-
104
-
105
-
106
-
107
-
108
-
109
-
110
-
111
-
112
-
113
-
114
-
115
-
116
-
117
-
118
-
119
-
120
-
121
-
122
-
123
-
124
-
125
-
126
-
127
-
128
-
129
-
130
-
131
-
132
-
133
-
134
-
135
-
136
-
137
-
138
-
139
-
140
-
141
-
142
-
143
-
144
-
145
-
146
-
147
-
148
-
149
-
150
-
151
-
152
-
153
-
154
-
155
-
156
-
157
-
158
-
159
-
160
-
161
-
162
-
163
-
164
-
165
-
166
-
167
-
168
-
169
-
170
-
171
-
172
-
173
-
174
-
175
-
176
-
177
-
178
-
179
-
180
-
181
-
182
-
183
-
184
-
185
-
186
-
187
-
188
-
189
-
190
-
191
-
192
-
193
-
194
-
195
-
196
-
197
-
198
-
199
-
200
-
201
-
202
-
203
-
204
-
205
-
206
-
207
-
208
 |
 |
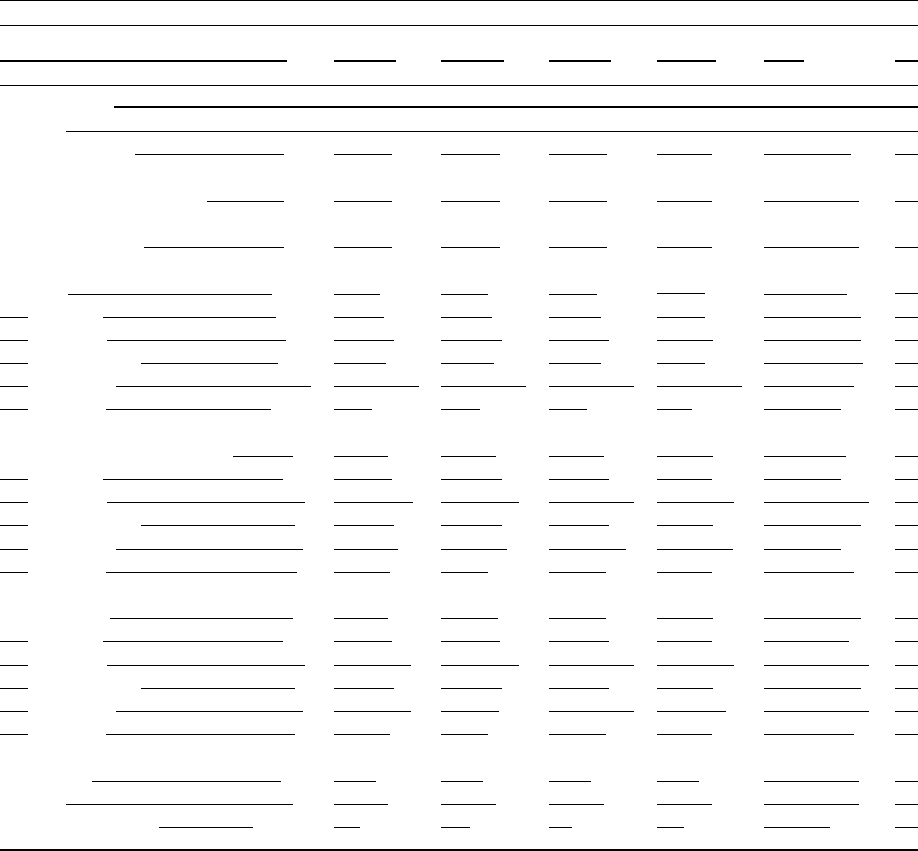
4
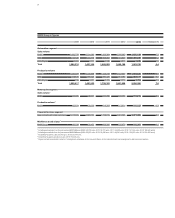
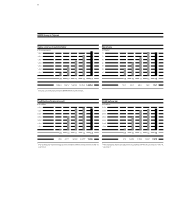
BMW Group in figures
2009 2010 2011 2012 2013 Change in %
Financial figures
in € million
Capital expenditure 3,471 3,263 3,692 5,240 6,687 27.6
Depreciation and amortisation 3,600 3,682 3,646 3,541 3,739 5.6
Operating cash flow 1 4,921 8,149 8,110 9,167 9,450 3.1
Revenues 50,681 60,477 68,821 76,848 76,058 – 1.0
Automotive 43,737 54,137 63,229 70,208 70,629 0.6
Motorcycles 1,069 1,304 1,436 1,490 1,504 0.9
Financial Services 15,798 16,617 17,510 19,550 19,874 1.7
Other Entities 3 4 5 5 6 20.0
Eliminations – 9,926 – 11,585 – 13,359 – 14,405 – 15,955 – 10.8
Profit before financial result (EBIT) 289 5,111 8,018 8,2752 7,986 – 3.5
Automotive – 265 4,355 7,477 7,5992 6,657 – 12.4
Motorcycles 19 71 45 9 79 –
Financial Services 355 1,201 1,763 1,558 1,643 5.5
Other Entities 30 – 41 – 19 58 44 – 24.1
Eliminations 150 – 475 – 1,248 – 949 – 437 54.0
Profit before tax 413 4,853 7,383 7,8032 7,913 1.4
Automotive – 588 3,887 6,823 7,1702 6,561 – 8.5
Motorcycles 11 65 41 6 76 –
Financial Services 365 1,214 1,790 1,561 1,639 5.0
Other Entities 51 45 – 168 32 164 –
Eliminations 574 – 358 – 1,103 – 937 – 527 43.8
Income taxes – 203 – 1,610 – 2,476 – 2,6922 – 2,573 4.4
Net profit 210 3,243 4,907 5,1112 5,340 4.5
Earnings per share3 in € 0.31 / 0.33 4.93 / 4.95 7.45 / 7.47 7.752 / 7.772 8.10 / 8.12 4.5 / 4.5
1 Cash inflow from operating activities of the Automotive segment.
2 Prior year figures have been adjusted in accordance with the revised version of IAS 19, see note 7.
3 Common / preferred stock. In computing earnings per share of preferred stock, earnings to cover the additional dividend of € 0.02 per share of preferred stock are spread over the
quarters of the corresponding financial year.