BMW 2013 Annual Report Download - page 29
Download and view the complete annual report
Please find page 29 of the 2013 BMW annual report below. You can navigate through the pages in the report by either clicking on the pages listed below, or by using the keyword search tool below to find specific information within the annual report.-
 1
1 -
2
-
3
-
4
-
5
-
6
-
7
-
8
-
9
-
10
-
11
-
12
-
13
-
14
-
15
-
16
-
17
-
18
-
 19
19 -
 20
20 -
 21
21 -
 22
22 -
 23
23 -
 24
24 -
 25
25 -
 26
26 -
 27
27 -
 28
28 -
 29
29 -
 30
30 -
 31
31 -
 32
32 -
 33
33 -
 34
34 -
 35
35 -
 36
36 -
 37
37 -
 38
38 -
 39
39 -
40
-
41
-
42
-
43
-
44
-
45
-
46
-
47
-
48
-
49
-
50
-
51
-
52
-
53
-
54
-
55
-
56
-
57
-
58
-
59
-
60
-
61
-
62
-
63
-
64
-
65
-
66
-
67
-
68
-
69
-
70
-
71
-
72
-
73
-
74
-
75
-
76
-
77
-
78
-
79
-
80
-
81
-
82
-
83
-
84
-
85
-
86
-
87
-
88
-
89
-
90
-
91
-
92
-
93
-
94
-
95
-
96
-
97
-
98
-
99
-
100
-
101
-
102
-
103
-
104
-
105
-
106
-
107
-
108
-
109
-
110
-
111
-
112
-
113
-
114
-
115
-
116
-
117
-
118
-
119
-
120
-
121
-
122
-
123
-
124
-
125
-
126
-
127
-
128
-
129
-
130
-
131
-
132
-
133
-
134
-
135
-
136
-
137
-
138
-
139
-
140
-
141
-
142
-
143
-
144
-
145
-
146
-
147
-
148
-
149
-
150
-
151
-
152
-
153
-
154
-
155
-
156
-
157
-
158
-
159
-
160
-
161
-
162
-
163
-
164
-
165
-
166
-
167
-
168
-
169
-
170
-
171
-
172
-
173
-
174
-
175
-
176
-
177
-
178
-
179
-
180
-
181
-
182
-
183
-
184
-
185
-
186
-
187
-
188
-
189
-
190
-
191
-
192
-
193
-
194
-
195
-
196
-
197
-
198
-
199
-
200
-
201
-
202
-
203
-
204
-
205
-
206
-
207
-
208
 |
 |

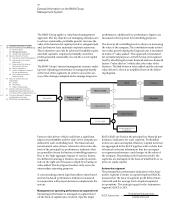
29 COMBINED MANAGEMENT REPORT
Report on Economic Position
Review of Operations
Sales volume at new all-time high
The BMW Group sold a total of 1,963,798* BMW, MINI
and Rolls-Royce brand vehicles during the year 2013,
the best sales volume performance ever achieved in the
Company’s history (2012: 1,845,186* units; + 6.4 %). De-
spite increasing volatility on many markets, particularly
in Europe, the BMW Group retained its pole position
in the premium segment worldwide.
All three brands set new sales volume records. Sales
of BMW brand cars rose by 7.5 % to 1,655,138* units
(2012: 1,540,085* units). In addition, 305,030 MINI
brand vehicles (2012: 301,526 units; + 1.2 %) and
3,630
Rolls-Royce brand vehicles (2012: 3,575 units;
+ 1.5 %) were sold.
Sharp sales volume rise in Asia
In Asia, we sold a total of 578,678* BMW, MINI and
Rolls-Royce brand cars in 2013 (+ 17.3 %), easily surpass-
ing the 500,000 threshold for the first time. Sales on
the Chinese mainland rose by 19.7 % to 391,713* units.
The Americas also made a good contribution to the
overall performance, with 463,822 units (+ 9.0 %) sold in
this region, including 376,636 units sold in the USA
(+ 8.1 %).
Despite ongoing uncertainties in Europe, sales in this
region were almost at the previous year’s level with
AUTOMOTIVE SEGMENT
a sales volume of 859,546 units (– 0.7 %). In Germany,
the BMW Group was unable to escape the steep down-
ward market trend, which resulted in sales volume
falling by 9.8 % to 259,219 units. It was a very different
story in the UK, where the keys to 189,121 BMW,
MINI and Rolls-Royce brand cars (+ 8.4 %) were handed
over to customers during the twelve-month period
under report.
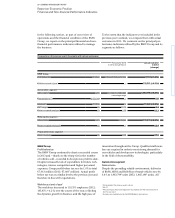
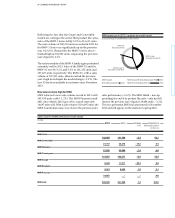
BMW Group – key automobile markets 2013
as a percentage of sales volume
China* 19.9 France 3.3
USA 19.2 Japan 3.3
Germany 13.2 Italy 3.0
Great Britain 9.6 Other 28.5
Great Britain
Other China*
USA
Italy
Japan
France
Germany
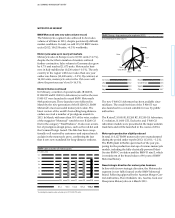
BMW Group sales volume of vehicles by region and market
in 1,000 units
2,000
1,800
1,600
1,400
1,200
1,000
800
600
400
200
09 10 11 12 13
Europe 761.9 791.2 858.4 865.4 859.5
thereof Germany 267.5 267.2 285.3 287.4 259.2
Asia* 183.2 286.3 375.5 493.4 578.7
thereof China* 90.6 169.6 233.6 327.3 391.7
Americas 294.2 329.7 380.3 425.3 463.8
thereof USA 242.1 266.6 306.3 348.5 376.6
Other markets 47.0 54.0 54.8 61.1 61.8
Total 1,286.3 1,461.2 1,669.0 1,845.2 1,963.8
* Includes cars manufactured by the BMW Brilliance joint venture.
Europe
Americas
thereof Germany
thereof USA
Asia*
thereof China*
Other markets