BMW 2013 Annual Report Download - page 55
Download and view the complete annual report
Please find page 55 of the 2013 BMW annual report below. You can navigate through the pages in the report by either clicking on the pages listed below, or by using the keyword search tool below to find specific information within the annual report.-
 1
1 -
2
-
3
-
4
-
5
-
6
-
7
-
8
-
9
-
10
-
11
-
12
-
13
-
14
-
15
-
16
-
17
-
18
-
19
-
20
-
21
-
22
-
23
-
24
-
25
-
26
-
27
-
28
-
29
-
30
-
31
-
32
-
33
-
34
-
35
-
36
-
37
-
38
-
39
-
40
-
41
-
42
-
43
-
44
-
 45
45 -
 46
46 -
 47
47 -
 48
48 -
 49
49 -
 50
50 -
 51
51 -
 52
52 -
 53
53 -
 54
54 -
 55
55 -
 56
56 -
 57
57 -
 58
58 -
 59
59 -
 60
60 -
 61
61 -
 62
62 -
 63
63 -
 64
64 -
 65
65 -
66
-
67
-
68
-
69
-
70
-
71
-
72
-
73
-
74
-
75
-
76
-
77
-
78
-
79
-
80
-
81
-
82
-
83
-
84
-
85
-
86
-
87
-
88
-
89
-
90
-
91
-
92
-
93
-
94
-
95
-
96
-
97
-
98
-
99
-
100
-
101
-
102
-
103
-
104
-
105
-
106
-
107
-
108
-
109
-
110
-
111
-
112
-
113
-
114
-
115
-
116
-
117
-
118
-
119
-
120
-
121
-
122
-
123
-
124
-
125
-
126
-
127
-
128
-
129
-
130
-
131
-
132
-
133
-
134
-
135
-
136
-
137
-
138
-
139
-
140
-
141
-
142
-
143
-
144
-
145
-
146
-
147
-
148
-
149
-
150
-
151
-
152
-
153
-
154
-
155
-
156
-
157
-
158
-
159
-
160
-
161
-
162
-
163
-
164
-
165
-
166
-
167
-
168
-
169
-
170
-
171
-
172
-
173
-
174
-
175
-
176
-
177
-
178
-
179
-
180
-
181
-
182
-
183
-
184
-
185
-
186
-
187
-
188
-
189
-
190
-
191
-
192
-
193
-
194
-
195
-
196
-
197
-
198
-
199
-
200
-
201
-
202
-
203
-
204
-
205
-
206
-
207
-
208
 |
 |

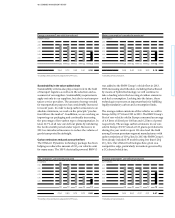
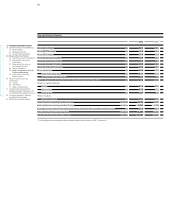
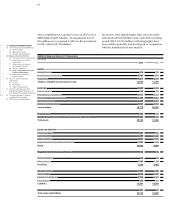
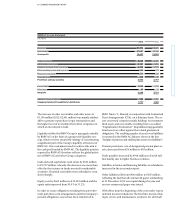
55 COMBINED MANAGEMENT REPORT
period, leased products accounted for 18.7 % of total as-
sets, similar to their level one year earlier (18.6 %). Ad-
justed for exchange rate factors, they went up by 8.1 %.
Non-current receivables from sales financing accounted
for 23.6 % (2012: 24.5 %) of total assets, current receiva-
bles from sales financing for 15.5 % (2012: 15.6 %). Total
receivables from sales financing relate to retail customer
and dealer financing (€ 40,841 million) and finance
leases
(€ 13,276 million). Adjusted for exchange rate factors,
non-current receivables from sales financing went up by
7.6 %, while current receivables from sales financing
rose by 10.4 %. This includes the negative impact of the
depreciation in value of a number of major currencies
against the euro.
Within current assets, increases were registered for
other
assets (€ 601 million) and financial assets (€ 947 million).
Favourable developments with currency derivatives
as well as the purchase of commercial paper and invest-
ment certificates caused financial assets to rise. Other
assets relate to receivables from other companies in
which an investment is held, advance payments to sup-
pliers and collateral receivables.
Compared to the end of the previous year, inventories
decreased by € 140 million (1.4 %) to € 9,585 million and
accounted for 6.9 % (2012: 7.4 %) of total assets. The
decrease relates primarily to finished goods. Adjusted
for exchange rate factors, inventories increased by 1.7 %.
Trade receivables were € 94 million lower than at the end
of the previous year and accounted for 1.8 % of total
assets (2012: 1.9 %). Adjusted for exchange rate factors,
trade receivables decreased by 1.2 %.
Cash and cash equivalents went down by € 706 million to
€ 7,664 million.
On the equity and liabilities side of the balance sheet, in-
creases were recorded for equity (16.5 %), trade payables
(16.2 %), non-current financial liabilities (0.9 %) and
current financial liabilities (1.5 %). By contrast, pension
provisions decreased by 39.6 %.
Group equity rose by € 5,037 million to € 35,643 million,
mainly due to the profit attributable to shareholders of
BMW AG totalling € 5,314 million. Currency translation
differences reduced equity by € 635 million. Deferred
taxes on items recognised directly in equity had the
effect of reducing equity by € 779 million. Group equity
increased on account of remeasurements of the net
defined benefit liability for pension plans (€ 1,308 mil-
lion), primarily as a
result of the higher discount rates
used in Germany and the USA. Fair value measurement
of derivative financial instruments (€ 1,357 million)
and
marketable securities (€ 8 million) had a positive im-
pact on equity. Income and expenses relating to equity
accounted investments and recognised directly in equity
(before tax) reduced equity by € 7 million. The divi-
dend
payment decreased equity by € 1,640 million. Mi-
nority interests increased by € 81 million. Other changes
amounted to € 13 million.
A portion of the Authorised Capital created at the
Annual General Meeting held on 14 May 2009 in con-
junction with the employee share scheme was used
during the financial year under report to issue shares
of
preferred stock to employees. An amount of € 17 mil-
lion was transferred to capital reserves in conjunction
with this share capital increase.
The equity ratio of the BMW Group improved overall
by 2.6 percentage points to 25.8 %. The equity ratio of
the Automotive segment was 43.1 % (2012: 41.0 %) and
that of the Financial Services segment was 9.1 % (2012:
8.6 %).
Pension provisions decreased from € 3,813 million to
€ 2,303 million at the two respective year ends, mainly
as a result of the higher discount factors used in Ger-
many and the USA.
Trade payables went up from € 6,433 million to € 7,475 mil-
lion,
mainly reflecting higher production volumes and
increased capital expenditure levels. Trade payables ac-
counted for 5.4 % of the balance sheet total at the end
of the reporting period (2012: 4.9 %). Adjusted for ex-
change
rate factors, they increased by 17.9 %.
Current and non-current financial liabilities increased
from € 69,507 to € 70,304 million over the twelve-month
period. Within financial liabilities, commercial paper
went up by 37.5 %, ABS transactions by 7.6 % and bonds
by 1.7 %. By contrast, liabilities to banks went down
by 9.4 % and deposit liabilities by 4.3 %. Adjusted for