BMW 2013 Annual Report Download - page 196
Download and view the complete annual report
Please find page 196 of the 2013 BMW annual report below. You can navigate through the pages in the report by either clicking on the pages listed below, or by using the keyword search tool below to find specific information within the annual report.-
 1
1 -
2
-
3
-
4
-
5
-
6
-
7
-
8
-
9
-
10
-
11
-
12
-
13
-
14
-
15
-
16
-
17
-
18
-
19
-
20
-
21
-
22
-
23
-
24
-
25
-
26
-
27
-
28
-
29
-
30
-
31
-
32
-
33
-
34
-
35
-
36
-
37
-
38
-
39
-
40
-
41
-
42
-
43
-
44
-
45
-
46
-
47
-
48
-
49
-
50
-
51
-
52
-
53
-
54
-
55
-
56
-
57
-
58
-
59
-
60
-
61
-
62
-
63
-
64
-
65
-
66
-
67
-
68
-
69
-
70
-
71
-
72
-
73
-
74
-
75
-
76
-
77
-
78
-
79
-
80
-
81
-
82
-
83
-
84
-
85
-
86
-
87
-
88
-
89
-
90
-
91
-
92
-
93
-
94
-
95
-
96
-
97
-
98
-
99
-
100
-
101
-
102
-
103
-
104
-
105
-
106
-
107
-
108
-
109
-
110
-
111
-
112
-
113
-
114
-
115
-
116
-
117
-
118
-
119
-
120
-
121
-
122
-
123
-
124
-
125
-
126
-
127
-
128
-
129
-
130
-
131
-
132
-
133
-
134
-
135
-
136
-
137
-
138
-
139
-
140
-
141
-
142
-
143
-
144
-
145
-
146
-
147
-
148
-
149
-
150
-
151
-
152
-
153
-
154
-
155
-
156
-
157
-
158
-
159
-
160
-
161
-
162
-
163
-
164
-
165
-
166
-
167
-
168
-
169
-
170
-
171
-
172
-
173
-
174
-
175
-
176
-
177
-
178
-
179
-
180
-
181
-
182
-
183
-
184
-
185
-
 186
186 -
 187
187 -
 188
188 -
 189
189 -
 190
190 -
 191
191 -
 192
192 -
 193
193 -
 194
194 -
 195
195 -
 196
196 -
 197
197 -
 198
198 -
 199
199 -
 200
200 -
 201
201 -
 202
202 -
 203
203 -
 204
204 -
 205
205 -
 206
206 -
207
-
208
 |
 |

196
196 OTHER INFORMATION
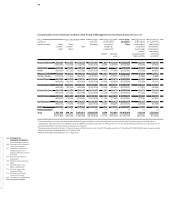
196 BMW Group Ten-year Comparison
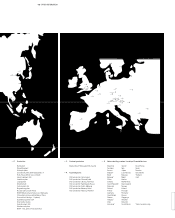
198 BMW Group Locations
200 Glossary
202 Index
203 Index of Graphs
204 Financial Calendar
205 Contacts
2013 2012 2011 2010
Sales volume
Automobiles units 1,963,798 1,845,186 1,668,982 1,461,166
Motorcycles2 units 115,215 106,358 104,286 98,047
Production volume
Automobiles units 2,006,366 1,861,826 1,738,160 1,481,253
Motorcycles2 units 110,127 113,811 110,360 99,236
Financial Services
Contract portfolio contracts 4,130,002 3,846,364 3,592,093 3,190,353
Business volume (based on balance sheet carrying amounts)3 € million 84,347 80,974 75,245 66,233
Income Statement
Revenues € million 76,058 76,848 68,821 60,477
Gross profit margin Group4 % 20.1 20.2 21.1 18.1
Profit before financial result € million 7,986 8,2755 8,018 5,111
Profit before tax € million 7,913 7,803 5 7,383 4,853
Return on sales (earnings before tax / revenues) % 10.4 10.2 10.7 8.0
Income taxes € million 2,573 2,6925 2,476 1,610
Effective tax rate % 32.5 34.5 33.5 33.1
Net profit for the year € million 5,340 5,1115 4,907 3,243
Balance Sheet
Non-current assets € million 86,194 81,3055 74,425 67,013
Current assets € million 52,174 50,5305 49,004 43,151
Equity € million 35,643 30,6065 27,103 23,930
Equity ratio Group % 25.8 23.25 22.0 21.7
Non-current provisions and liabilities € million 52,682 52,8345 49,113 46,100
Current provisions and liabilities € million 50,043 48,3955 47,213 40,134
Balance sheet total € million 138,368 131,835 5 123,429 110,164
Cash Flow Statement
Cash and cash equivalents at balance sheet date € million 7,664 8,370 7,776 7,432
Operating cash flow 6 € million 9,450 9,167 8,1107 8,149
Capital expenditure € million 6,687 5,240 3,692 3,263
Capital expenditure ratio (capital expenditure / revenues) % 8.8 6.8 5.4 5.4
Personnel
Workforce at the end of year8 110,351 105,876 100,306 95,453
Personnel cost per employee € 89,895 89,1615 84,887 83,141
Dividend
Dividend total € million 1,707 1,640 1,508 852
Dividend per share of common stock / preferred stock € 2.60 / 2.62 2.50 /2.52 2.30 / 2.32 1.30 /1.32
1 Adjusted for the new accounting treatment of pension obligations.
2 Excluding Husqvarna, sales volume up to 2013: 59,776 units; production up to 2013: 59,426 units.
3 Amount computed on the basis of balance sheet figures: until 2007 from the Group balance sheet, from 2008 onwards from the Financial Services segment balance sheet.
4 Research and development expenses included in cost of sales with the effect from 2008.
5 Prior year figures have been adjusted in accordance with the revised version of IAS 19, see note 7.
6 Figures are reported in the cash flow statement up to 2006 as cash inflow from operating activities of Industrial Operations and from 2007 as cash inflow from
operating activities of the Automotive segment.
7 Adjusted for reclassifications as described in note 42 of the Financial Statements 2012.
8 Figures exclude dormant employment contracts, employees in the non-work phases of pre-retirement part-time arrangements and low wage earners.
9 Adjustment to dividend due to buy-back of treasury shares.
OTHER INFORMATION
BMW Group Ten-year Comparison