Experian 2008 Annual Report Download - page 98
Download and view the complete annual report
Please find page 98 of the 2008 Experian annual report below. You can navigate through the pages in the report by either clicking on the pages listed below, or by using the keyword search tool below to find specific information within the annual report.-
 1
1 -
2
-
3
-
4
-
5
-
6
-
7
-
8
-
9
-
10
-
11
-
12
-
13
-
14
-
15
-
16
-
17
-
18
-
19
-
20
-
21
-
22
-
23
-
24
-
25
-
26
-
27
-
28
-
29
-
30
-
31
-
32
-
33
-
34
-
35
-
36
-
37
-
38
-
39
-
40
-
41
-
42
-
43
-
44
-
45
-
46
-
47
-
48
-
49
-
50
-
51
-
52
-
53
-
54
-
55
-
56
-
57
-
58
-
59
-
60
-
61
-
62
-
63
-
64
-
65
-
66
-
67
-
68
-
69
-
70
-
71
-
72
-
73
-
74
-
75
-
76
-
77
-
78
-
79
-
80
-
81
-
82
-
83
-
84
-
85
-
86
-
87
-
 88
88 -
 89
89 -
 90
90 -
 91
91 -
 92
92 -
 93
93 -
 94
94 -
 95
95 -
 96
96 -
 97
97 -
 98
98 -
 99
99 -
 100
100 -
 101
101 -
 102
102 -
 103
103 -
 104
104 -
 105
105 -
 106
106 -
 107
107 -
 108
108 -
109
-
110
-
111
-
112
-
113
-
114
-
115
-
116
-
117
-
118
-
119
-
120
-
121
-
122
-
123
-
124
-
125
-
126
-
127
-
128
-
129
-
130
-
131
-
132
-
133
-
134
-
135
-
136
-
137
-
138
-
139
-
140
-
141
-
142
-
143
-
144
-
145
-
146
-
147
-
148
 |
 |

96 Experian Annual Report 2008
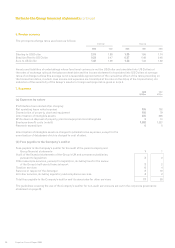
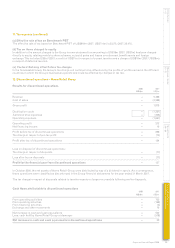
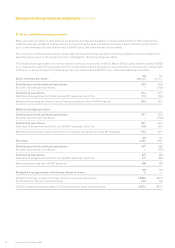
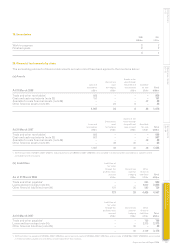
13. Basic and diluted earnings per share
Basic earnings per share is calculated by dividing the earnings attributable to ordinary shareholders of the Company by a
weighted average number of ordinary shares in issue during the year (excluding own shares held in Treasury in the period
prior to the demerger and own shares held in ESOP trusts, which are treated as cancelled).
The calculation of diluted earnings per share reflects the potential dilutive effect of employee share incentive schemes. The
earnings figures used in the calculations are unchanged for diluted earnings per share.
The weighted average number of ordinary shares in issue during the year ended 31 March 2007 includes ordinary shares of GUS
plc in issue to the date of the demerger and the ordinary shares of the Company in issue thereafter (excluding own shares held
in Treasury in the period prior to the demerger and own shares held in ESOP trusts, which are treated as cancelled).
2008 2007
Basic earnings per share: US cents US cents
Continuing and discontinued operations 43.3 49.9
Exclude: discontinued operations – (14.8)
Continuing operations 43.3 35.1
Add back of exceptional and other non-GAAP measures, net of tax 17.0 24.6
Benchmark earnings per share from continuing operations (non-GAAP measure) 60.3 59.7
Diluted earnings per share:
Continuing and discontinued operations 42.7 49.3
Exclude: discontinued operations – (14.6)
Continuing operations 42.7 34.7
Add back of exceptional and other non-GAAP measures, net of tax 16.8 24.4
Benchmark diluted earnings per share from continuing operations (non-GAAP measure) 59.5 59.1
2008 2007
Earnings: US$m US$m
Continuing and discontinued operations 437 462
Exclude: discontinued operations – (137)
Continuing operations 437 325
Add back of exceptional and other non-GAAP measures, net of tax 171 229
Benchmark earnings (non-GAAP measure) 608 554
2008 2007
Weighted average number of ordinary shares in issue: m m
Weighted average number of ordinary shares in issue during the year 1,008.9 927.3
Dilutive effect of share incentive awards 13.4 9.9
Diluted weighted average number of ordinary shares in issue during the year 1,022.3 937.2
Notes to the Group financial statements continued