Experian 2008 Annual Report Download - page 95
Download and view the complete annual report
Please find page 95 of the 2008 Experian annual report below. You can navigate through the pages in the report by either clicking on the pages listed below, or by using the keyword search tool below to find specific information within the annual report.-
 1
1 -
2
-
3
-
4
-
5
-
6
-
7
-
8
-
9
-
10
-
11
-
12
-
13
-
14
-
15
-
16
-
17
-
18
-
19
-
20
-
21
-
22
-
23
-
24
-
25
-
26
-
27
-
28
-
29
-
30
-
31
-
32
-
33
-
34
-
35
-
36
-
37
-
38
-
39
-
40
-
41
-
42
-
43
-
44
-
45
-
46
-
47
-
48
-
49
-
50
-
51
-
52
-
53
-
54
-
55
-
56
-
57
-
58
-
59
-
60
-
61
-
62
-
63
-
64
-
65
-
66
-
67
-
68
-
69
-
70
-
71
-
72
-
73
-
74
-
75
-
76
-
77
-
78
-
79
-
80
-
81
-
82
-
83
-
84
-
 85
85 -
 86
86 -
 87
87 -
 88
88 -
 89
89 -
 90
90 -
 91
91 -
 92
92 -
 93
93 -
 94
94 -
 95
95 -
 96
96 -
 97
97 -
 98
98 -
 99
99 -
 100
100 -
 101
101 -
 102
102 -
 103
103 -
 104
104 -
 105
105 -
106
-
107
-
108
-
109
-
110
-
111
-
112
-
113
-
114
-
115
-
116
-
117
-
118
-
119
-
120
-
121
-
122
-
123
-
124
-
125
-
126
-
127
-
128
-
129
-
130
-
131
-
132
-
133
-
134
-
135
-
136
-
137
-
138
-
139
-
140
-
141
-
142
-
143
-
144
-
145
-
146
-
147
-
148
 |
 |

93Experian Annual Report 2008
Introduction
2 – 5
Business review
6 – 37
Governance
38 – 64
Financial statements
Group financial statements
Financial statements
Group financial statements
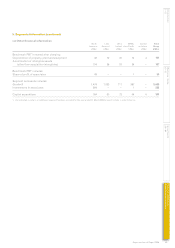
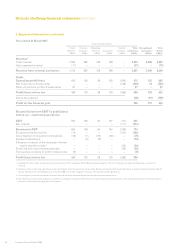
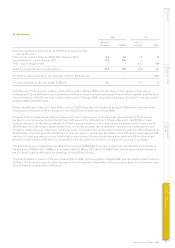
9. Exceptional and other non-GAAP measures (continued)
Other non-GAAP measures
IFRS requires that, on acquisition, specific intangible assets are identified and recognised separately from goodwill and then
amortised over their useful economic lives. These include items such as brand names and customer lists, to which value
is first attributed at the time of acquisition. The Group has excluded amortisation of these acquisition intangibles from its
definition of Benchmark PBT because such a charge is based on uncertain judgements about their value and economic life.
A goodwill adjustment of US$2m (2007: US$14m) arose under IFRS 3 ‘Business Combinations’ on the recognition of
previously unrecognised tax losses on prior years’ acquisitions. The corresponding tax benefit reduced the tax charge for the
year by US$2m (2007: US$14m).
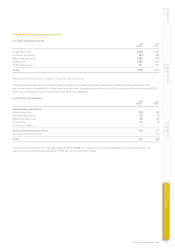
Charges in respect of demerger-related equity incentive plans relate to one-off grants made to senior management and at
all staff levels at the time of the demerger, under a number of equity incentive plans. The cost of these one-off grants is being
charged to the Group income statement over the five years from flotation in October 2006 but excluded from the definition of
Benchmark PBT. The cost of all other grants is being charged to the Group income statement and included in the definition of
Benchmark PBT.
An element of the Group’s derivatives is ineligible for hedge accounting under IFRS. Gains or losses on these derivatives
arising from market movements are credited or charged to financing fair value remeasurements within finance income and
finance expense in the Group income statement.
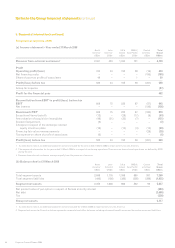
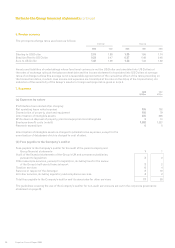
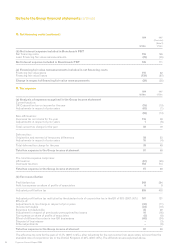
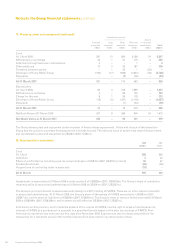
10. Net financing costs
2008 2007
(Restated)
(Note 2)
US$m US$m
(a) Net financing costs
Interest income:
Bank deposits and money market funds 19 10
Loan notes – 1
Interest differentials on derivatives 1 17
Expected return on pension scheme assets 76 68
Interest income 96 96
Financing fair value gains:
Fair value gains on borrowings attributable to interest rate risk 34 55
Fair value gains on non-hedging derivatives – 7
Ineffective portion of net investment hedges 7 –
Movement in fair value of Serasa put option (note 29(d)) 69 –
Financing fair value gains 110 62
Finance income 206 158
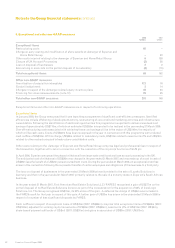
Interest expense:
Bank loans and overdrafts 76 41
Eurobonds and notes 90 112
Commitment and facility utilisation fees 1 2
Finance lease interest expense 2 –
Interest expense on pension scheme liabilities 53 52
Interest expense 222 207
Financing fair value losses:
Losses on interest rate swaps – fair value hedges 35 60
Fair value losses on non-hedging derivatives 98 26
Foreign exchange transaction losses 6 11
Financing fair value losses 139 97
Finance expense 361 304
Net financing costs 155 146