Experian 2008 Annual Report Download - page 97
Download and view the complete annual report
Please find page 97 of the 2008 Experian annual report below. You can navigate through the pages in the report by either clicking on the pages listed below, or by using the keyword search tool below to find specific information within the annual report.-
 1
1 -
2
-
3
-
4
-
5
-
6
-
7
-
8
-
9
-
10
-
11
-
12
-
13
-
14
-
15
-
16
-
17
-
18
-
19
-
20
-
21
-
22
-
23
-
24
-
25
-
26
-
27
-
28
-
29
-
30
-
31
-
32
-
33
-
34
-
35
-
36
-
37
-
38
-
39
-
40
-
41
-
42
-
43
-
44
-
45
-
46
-
47
-
48
-
49
-
50
-
51
-
52
-
53
-
54
-
55
-
56
-
57
-
58
-
59
-
60
-
61
-
62
-
63
-
64
-
65
-
66
-
67
-
68
-
69
-
70
-
71
-
72
-
73
-
74
-
75
-
76
-
77
-
78
-
79
-
80
-
81
-
82
-
83
-
84
-
85
-
86
-
 87
87 -
 88
88 -
 89
89 -
 90
90 -
 91
91 -
 92
92 -
 93
93 -
 94
94 -
 95
95 -
 96
96 -
 97
97 -
 98
98 -
 99
99 -
 100
100 -
 101
101 -
 102
102 -
 103
103 -
 104
104 -
 105
105 -
 106
106 -
 107
107 -
108
-
109
-
110
-
111
-
112
-
113
-
114
-
115
-
116
-
117
-
118
-
119
-
120
-
121
-
122
-
123
-
124
-
125
-
126
-
127
-
128
-
129
-
130
-
131
-
132
-
133
-
134
-
135
-
136
-
137
-
138
-
139
-
140
-
141
-
142
-
143
-
144
-
145
-
146
-
147
-
148
 |
 |

95Experian Annual Report 2008
Introduction
2 – 5
Business review
6 – 37
Governance
38 – 64
Financial statements
Group financial statements
Financial statements
Group financial statements
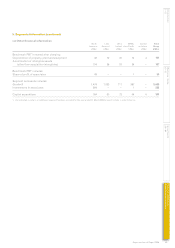
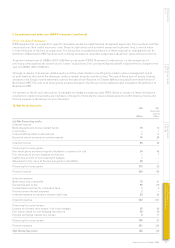
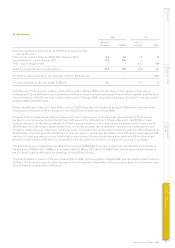
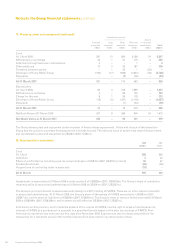
11. Tax expense (continued)
(c) Effective rate of tax on Benchmark PBT
The effective rate of tax based on Benchmark PBT of US$819m (2007: US$714m) is 23.2% (2007: 22.4%).
(d) Tax on items charged to equity
In addition to the amount charged to the Group income statement tax amounting to US$16m (2007: US$7m) has been charged
directly to equity, relating mainly to share schemes, actuarial gains and losses on retirement benefit assets and foreign
exchange. This includes US$nil (2007: a credit of US$11m) in respect of current taxation and a charge of US$16m (2007: US$18m)
in respect of deferred taxation.
(e) Factors that may affect future tax charges
In the foreseeable future, the Group’s tax charge will continue to be influenced by the profile of profits earned in the different
countries in which the Group’s businesses operate and could be affected by changes in tax law.
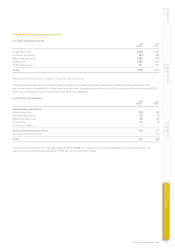
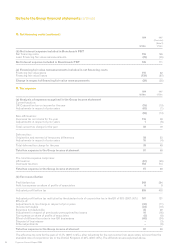
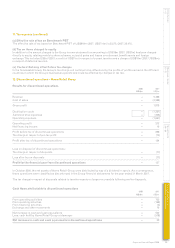
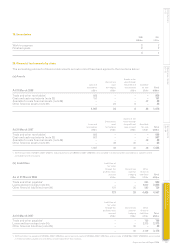
12. Discontinued operations – Home Retail Group
Results for discontinued operations
2008 2007
US$m US$m
Revenue – 5,468
Cost of sales – (3,589)
Gross profit – 1,879
Distribution costs – (1,361)
Administrative expenses – (306)
Operating expenses – (1,667)
Operating profit – 212
Net financing income – 16
Profit before tax of discontinued operations – 228
Tax charge in respect of pre-tax profit – (74)
Profit after tax of discontinued operations – 154
Loss on disposal of discontinued operations:
Tax charge in respect of disposals – (17)
Loss after tax on disposals – (17)
Profit for the financial year from discontinued operations – 137
In October 2006, the net assets of Home Retail Group were distributed by way of a dividend in specie. As a consequence,
these operations were classified as discontinued in the Group financial statements for the year ended 31 March 2007.
The tax charge in respect of disposals related to taxation assets no longer recoverable following earlier disposals.
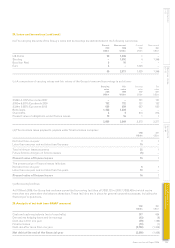
Cash flows attributable to discontinued operations
2008 2007
US$m US$m
From operating activities – 705
From investing activities – (168)
From financing activities – (3)
Exchange and other movements – 16
Net increase in cash and cash equivalents – 550
Less: cash held by Home Retail Group at demerger – (518)
Net increase in cash and cash equivalents in discontinued operations – 32