Experian 2008 Annual Report Download - page 25
Download and view the complete annual report
Please find page 25 of the 2008 Experian annual report below. You can navigate through the pages in the report by either clicking on the pages listed below, or by using the keyword search tool below to find specific information within the annual report.-
 1
1 -
2
-
3
-
4
-
5
-
6
-
7
-
8
-
9
-
10
-
11
-
12
-
13
-
14
-
 15
15 -
 16
16 -
 17
17 -
 18
18 -
 19
19 -
 20
20 -
 21
21 -
 22
22 -
 23
23 -
 24
24 -
 25
25 -
 26
26 -
 27
27 -
 28
28 -
 29
29 -
 30
30 -
 31
31 -
 32
32 -
 33
33 -
 34
34 -
 35
35 -
36
-
37
-
38
-
39
-
40
-
41
-
42
-
43
-
44
-
45
-
46
-
47
-
48
-
49
-
50
-
51
-
52
-
53
-
54
-
55
-
56
-
57
-
58
-
59
-
60
-
61
-
62
-
63
-
64
-
65
-
66
-
67
-
68
-
69
-
70
-
71
-
72
-
73
-
74
-
75
-
76
-
77
-
78
-
79
-
80
-
81
-
82
-
83
-
84
-
85
-
86
-
87
-
88
-
89
-
90
-
91
-
92
-
93
-
94
-
95
-
96
-
97
-
98
-
99
-
100
-
101
-
102
-
103
-
104
-
105
-
106
-
107
-
108
-
109
-
110
-
111
-
112
-
113
-
114
-
115
-
116
-
117
-
118
-
119
-
120
-
121
-
122
-
123
-
124
-
125
-
126
-
127
-
128
-
129
-
130
-
131
-
132
-
133
-
134
-
135
-
136
-
137
-
138
-
139
-
140
-
141
-
142
-
143
-
144
-
145
-
146
-
147
-
148
 |
 |
23Experian Annual Report 2008
Financial statements
65 – 144
Governance
38 – 64
Introduction
2 – 5
Business review
Financial review
Business review
Financial review
Business review
Financial review
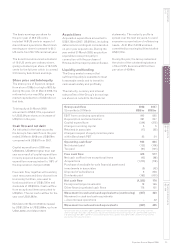
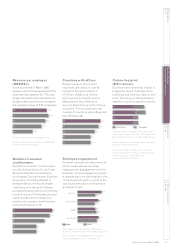
The basic earnings per share for
the prior year of 49.9 US cents
included 14.8 US cents in respect of
discontinued operations. Benchmark
earnings per share increased to 60.3
US cents from 59.7 US cents last year.
The board has announced a dividend
of 12.0 US cents per ordinary share,
giving a dividend per share of 18.5 US
cents for the full year which is covered
3.5 times by benchmark earnings.
Share price and total equity
The share price of Experian ranged
from a low of 358p to a high of 633.5p
during the year. On 31 March 2008, the
mid market price was 367p, giving a
market capitalisation of US$7.4bn at
that date.
Total equity at 31 March 2008
amounted to US$2,117m, equivalent
to US$2.09 per share, an increase of
US$10m in the year.
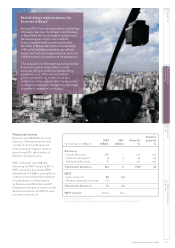
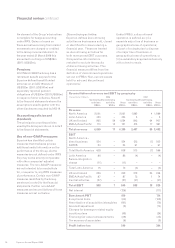
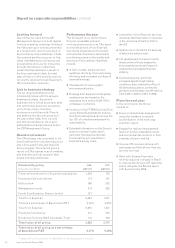
Cash flow and net debt
As indicated in the table opposite,
the Group’s free cash flow in the year
ended 31 March 2008 was US$679m
compared with US$577m in 2007.
Capital expenditure in 2008 was
US$344m, US$69m higher than last
year as a result of capital expenditure
in newly acquired businesses. Such
expenditure was equivalent to 118% of
the depreciation charge in 2008.
Free cash flow, together with existing
cash resources and draw downs from
borrowing facilities, was used to
fund acquisitions of US$1,720m and
dividends of US$193m. Cash outflow
from exceptional items amounted to
US$45m. The net cash outflow for the
year was US$1,282m.
Net debt at 31 March 2008 increased
by US$1,291m to US$2,699m, up from
US$1,408m at 31 March 2007.
Acquisitions
Acquisition expenditure amounted to
US$1,720m (2007: US$118m), including
deferred and contingent consideration
on prior year acquisitions. During the
year ended 31 March 2008, acquisition
expenditure was principally in
connection with the purchase of
Hitwise and the majority stake in Serasa.
Liquidity and funding
The Group seeks to ensure that
sufficient liquidity is available to meet
foreseeable needs and to invest its
cash assets safely and profitably.
The maturity, currency and interest
rate profiles of the Group’s borrowings
are shown in note 30 to the financial
statements. The maturity profile is
spread over the next six years, to avoid
excessive concentration of refinancing
needs. At 31 March 2008 undrawn
committed borrowing facilities totalled
US$1,121m.
During the year, the Group redeemed
the whole of the outstanding balance
of the 4.125% Euronotes 2007 at their
par value of €548m.
Group cash flow 2008 2007
12 months to 31 March US$m US$m
EBIT from continuing operations 945 825
Depreciation and amortisation 291 237
Capital expenditure (344) (275)
Change in working capital 5 5
Retained in associate (17) (22)
Charge in respect of equity incentive plans
within Benchmark PBT 22 34
Operating cash flow1 902 804
Net interest paid (132) (106)
Tax paid (91) (121)
Free cash flow 679 577
Net cash outflow from exceptional items (45) (98)
Acquisitions (1,720) (118)
Purchase of available for sale financial assets and
investments in associates (9) (42)
Disposal of subsidiaries 6 258
Dividends paid (193) (401)
Net cash flow (1,282) 176
Foreign exchange movements 19 166
Other financing related cash flows 776 121
Movement in cash and cash equivalents (continuing) (487) 463
Movement in cash and cash equivalents
– discontinued operations – 32
Movement in cash and cash equivalents (487) 495
1 Operating cash flow of US$902m (2007: US$804m) is derived from cash generated from operations in the Group cash flow
statement of US$1,165m (2007: US$942m) after adjusting for the outflow for capital expenditure of US$344m (2007: US$275m)
and adding US$36m (2007: US$39m) in respect of dividends from associates and US$45m (2007: US$98m) in respect of the
cash outflow from exceptional items