Experian 2008 Annual Report Download - page 89
Download and view the complete annual report
Please find page 89 of the 2008 Experian annual report below. You can navigate through the pages in the report by either clicking on the pages listed below, or by using the keyword search tool below to find specific information within the annual report.-
 1
1 -
2
-
3
-
4
-
5
-
6
-
7
-
8
-
9
-
10
-
11
-
12
-
13
-
14
-
15
-
16
-
17
-
18
-
19
-
20
-
21
-
22
-
23
-
24
-
25
-
26
-
27
-
28
-
29
-
30
-
31
-
32
-
33
-
34
-
35
-
36
-
37
-
38
-
39
-
40
-
41
-
42
-
43
-
44
-
45
-
46
-
47
-
48
-
49
-
50
-
51
-
52
-
53
-
54
-
55
-
56
-
57
-
58
-
59
-
60
-
61
-
62
-
63
-
64
-
65
-
66
-
67
-
68
-
69
-
70
-
71
-
72
-
73
-
74
-
75
-
76
-
77
-
78
-
 79
79 -
 80
80 -
 81
81 -
 82
82 -
 83
83 -
 84
84 -
 85
85 -
 86
86 -
 87
87 -
 88
88 -
 89
89 -
 90
90 -
 91
91 -
 92
92 -
 93
93 -
 94
94 -
 95
95 -
 96
96 -
 97
97 -
 98
98 -
 99
99 -
100
-
101
-
102
-
103
-
104
-
105
-
106
-
107
-
108
-
109
-
110
-
111
-
112
-
113
-
114
-
115
-
116
-
117
-
118
-
119
-
120
-
121
-
122
-
123
-
124
-
125
-
126
-
127
-
128
-
129
-
130
-
131
-
132
-
133
-
134
-
135
-
136
-
137
-
138
-
139
-
140
-
141
-
142
-
143
-
144
-
145
-
146
-
147
-
148
 |
 |

87Experian Annual Report 2008
Introduction
2 – 5
Business review
6 – 37
Governance
38 – 64
Financial statements
Group financial statements
Financial statements
Group financial statements
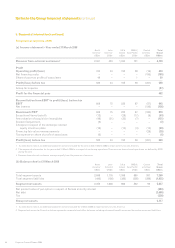
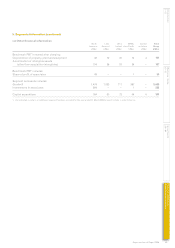
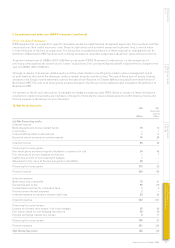
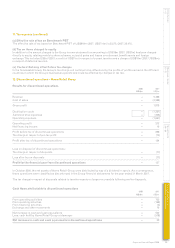
5. Segmental information (continued)
(c) Other financial information
Continuing operations
North Latin UK & EMEA/ Central Total Discontinued Total
America1 America1 Ireland Asia Pacific activities continuing operations2 Group
US$m US$m US$m US$m US$m US$m US$m US$m
Benchmark PBT is stated after charging:
Depreciation of property, plant and equipment 36 – 29 12 2 79 134 213
Amortisation of intangible assets
(other than acquisition intangibles) 102 – 32 16 – 150 11 161
Benchmark PBT includes:
Share of profit of associates 61 – – – – 61 – 61
Segment net assets includes:
Goodwill 1,376 – 524 319 – 2,219 – 2,219
Investments in associates 277 – – 9 – 286 – 286
Capital expenditure 167 1 67 40 – 275 173 448
1. As indicated in note 2, the segmental information presented in respect of the Americas for the year ended 31 March 2007 is now further analysed to show
North and Latin America as separate segments.
2. Additional information on discontinued operations, which comprise Home Retail Group, together with a tax charge in respect of disposals, is shown in note 12.
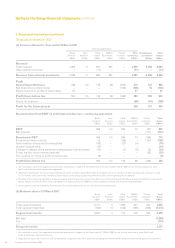
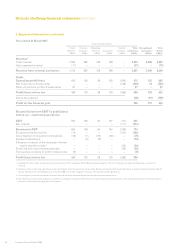
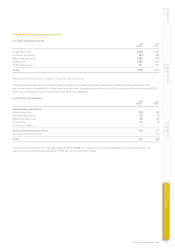
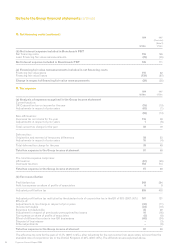
Business segments
(a) Income statement
Year ended 31 March 2008
Credit Decision Marketing Central To t a l
Services Analytics Services Interactive activities Group1
US$m US$m US$m US$m US$m US$m
Revenue from external customers2 1,972 469 830 859 – 4,130
Profit
Operating profit/(loss) 459 137 17 153 (112) 654
Net financing costs – – – – (155) (155)
Share of post-tax profits of associates 50 – – – – 50
Profit/(loss) before tax 509 137 17 153 (267) 549
Group tax expense (97)
Profit for the financial year 452
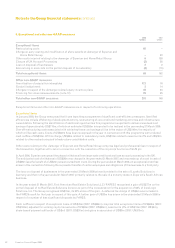
Reconciliation from EBIT to profit/(loss)
before tax
EBIT 581 154 78 189 (57) 945
Net interest – – – – (126) (126)
Benchmark PBT 581 154 78 189 (183) 819
Exceptional items (note 9) (21) (10) (22) (4) (6) (63)
Amortisation of acquisition intangibles (45) (7) (37) (32) – (121)
Goodwill adjustment – – (2) – – (2)
Charges in respect of the demerger-related
equity incentive plans3 – – – – (49) (49)
Financing fair value remeasurements – – – – (29) (29)
Tax expense on share of profit of associates (6) – – – – (6)
Profit/(loss) before tax 509 137 17 153 (267) 549
1. The segmental information for the year ended 31 March 2008 is in respect of continuing operations. There were no discontinued operations, as defined by IFRS,
during the year.
2. Revenue from external customers arose principally from the provision of services.
3. No allocation by business segment is made for charges in respect of the demerger-related equity incentive plans as the underlying data is maintained only to
provide an allocation by geographical segment.