Experian 2008 Annual Report Download - page 117
Download and view the complete annual report
Please find page 117 of the 2008 Experian annual report below. You can navigate through the pages in the report by either clicking on the pages listed below, or by using the keyword search tool below to find specific information within the annual report.-
 1
1 -
2
-
3
-
4
-
5
-
6
-
7
-
8
-
9
-
10
-
11
-
12
-
13
-
14
-
15
-
16
-
17
-
18
-
19
-
20
-
21
-
22
-
23
-
24
-
25
-
26
-
27
-
28
-
29
-
30
-
31
-
32
-
33
-
34
-
35
-
36
-
37
-
38
-
39
-
40
-
41
-
42
-
43
-
44
-
45
-
46
-
47
-
48
-
49
-
50
-
51
-
52
-
53
-
54
-
55
-
56
-
57
-
58
-
59
-
60
-
61
-
62
-
63
-
64
-
65
-
66
-
67
-
68
-
69
-
70
-
71
-
72
-
73
-
74
-
75
-
76
-
77
-
78
-
79
-
80
-
81
-
82
-
83
-
84
-
85
-
86
-
87
-
88
-
89
-
90
-
91
-
92
-
93
-
94
-
95
-
96
-
97
-
98
-
99
-
100
-
101
-
102
-
103
-
104
-
105
-
106
-
 107
107 -
 108
108 -
 109
109 -
 110
110 -
 111
111 -
 112
112 -
 113
113 -
 114
114 -
 115
115 -
 116
116 -
 117
117 -
 118
118 -
 119
119 -
 120
120 -
 121
121 -
 122
122 -
 123
123 -
 124
124 -
 125
125 -
 126
126 -
 127
127 -
128
-
129
-
130
-
131
-
132
-
133
-
134
-
135
-
136
-
137
-
138
-
139
-
140
-
141
-
142
-
143
-
144
-
145
-
146
-
147
-
148
 |
 |

115Experian Annual Report 2008
Introduction
2 – 5
Business review
6 – 37
Governance
38 – 64
Financial statements
Group financial statements
Financial statements
Group financial statements
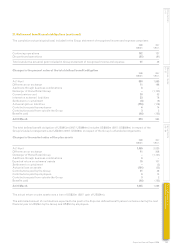
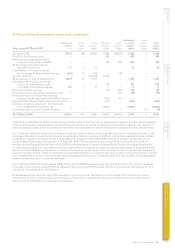
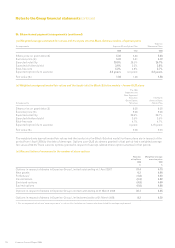
30. Additional information on financial liabilities (continued)
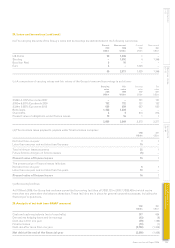
(d) Analysis by maturity profile (contractual, undiscounted cash flows):
Less than 1 - 2 2 - 3 3 - 4 4 - 5 Over 5
1 year years years years years years To t a l
At 31 March 2008 US$m US$m US$m US$m US$m US$m US$m
Loans and borrowings 127 783 43 41 1,473 701 3,168
Net settled derivative financial instruments (note 29 (c)) 34 – 17 13 12 12 88
Gross settled derivative financial instruments (note 29 (c)) 1,223 – – – – – 1,223
Put option in respect of acquisition of
Serasa minority interest – – – – 1,003 – 1,003
Trade and other payables1 947 26 25 1 1 – 1,000
2,331 809 85 55 2,489 713 6,482
Less than 1 - 2 2 - 3 3 - 4 4 - 5 Over 5
1 year years years years years years To t a l
At 31 March 2007 US$m US$m US$m US$m US$m US$m US$m
Loans and borrowings 1,115 81 768 37 37 730 2,768
Net settled derivative financial instruments (note 29 (c)) (5) 14 15 12 12 24 72
Gross settled derivative financial instruments (note 29 (c)) 1,780 – – – – – 1,780
Trade and other payables1 656 63 3 1 1 1 725
3,546 158 786 50 50 755 5,345
1. Cash flows in respect of VAT, other tax payable, social security costs and accruals are excluded from this analysis.
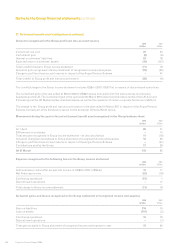
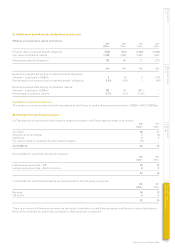
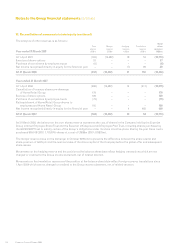
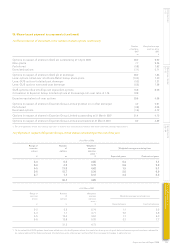
31. Deferred tax
2008 2007
(a) Net deferred tax (liabilities)/assets US$m US$m
At 1 April 35 197
Differences on exchange (11) –
Income statement charge (note 11) (including US$nil (2007: US$5m) relating to discontinued operations) (38) (54)
Business combinations (note 34) (90) (2)
Demerger of Home Retail Group – (89)
Tax charged to equity (16) (18)
Tr a n s f e r s (24) 1
At 31 March (144) 35
Net deferred tax (liabilities)/assets have been presented in the Group balance sheet as follows:
Deferred tax assets 26 103
Deferred tax liabilities (170) (68)
(144) 35
The movement in gross deferred tax assets and liabilities during the year, without taking into consideration the offsetting of
balances within the same tax jurisdiction, is shown below.
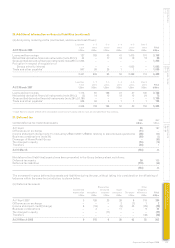
(b) Deferred tax assets
Share option Other
Accelerated and award Asset temporary
depreciation Intangibles schemes provisions Tax losses differences To t a l
US$m US$m US$m US$m US$m US$m US$m
At 1 April 2007 3 128 20 26 8 119 304
Differences on exchange – – – 2 (1) 1 2
Income statement credit/(charge) 6 (16) – (9) 35 (29) (13)
Business combinations – 3 – 17 – 9 29
Tax charged to equity – – (11) – – – (11)
Transfers – – – – – (48) (48)
At 31 March 2008 9 115 9 36 42 52 263