Experian 2008 Annual Report Download - page 106
Download and view the complete annual report
Please find page 106 of the 2008 Experian annual report below. You can navigate through the pages in the report by either clicking on the pages listed below, or by using the keyword search tool below to find specific information within the annual report.-
 1
1 -
2
-
3
-
4
-
5
-
6
-
7
-
8
-
9
-
10
-
11
-
12
-
13
-
14
-
15
-
16
-
17
-
18
-
19
-
20
-
21
-
22
-
23
-
24
-
25
-
26
-
27
-
28
-
29
-
30
-
31
-
32
-
33
-
34
-
35
-
36
-
37
-
38
-
39
-
40
-
41
-
42
-
43
-
44
-
45
-
46
-
47
-
48
-
49
-
50
-
51
-
52
-
53
-
54
-
55
-
56
-
57
-
58
-
59
-
60
-
61
-
62
-
63
-
64
-
65
-
66
-
67
-
68
-
69
-
70
-
71
-
72
-
73
-
74
-
75
-
76
-
77
-
78
-
79
-
80
-
81
-
82
-
83
-
84
-
85
-
86
-
87
-
88
-
89
-
90
-
91
-
92
-
93
-
94
-
95
-
 96
96 -
 97
97 -
 98
98 -
 99
99 -
 100
100 -
 101
101 -
 102
102 -
 103
103 -
 104
104 -
 105
105 -
 106
106 -
 107
107 -
 108
108 -
 109
109 -
 110
110 -
 111
111 -
 112
112 -
 113
113 -
 114
114 -
 115
115 -
 116
116 -
117
-
118
-
119
-
120
-
121
-
122
-
123
-
124
-
125
-
126
-
127
-
128
-
129
-
130
-
131
-
132
-
133
-
134
-
135
-
136
-
137
-
138
-
139
-
140
-
141
-
142
-
143
-
144
-
145
-
146
-
147
-
148
 |
 |

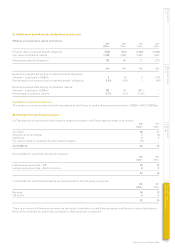
104 Experian Annual Report 2008
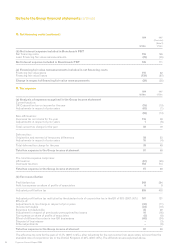
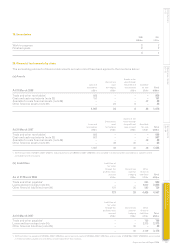
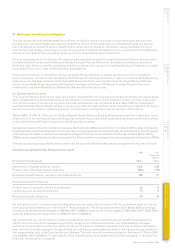
22. Cash and cash equivalents (continued)
(b) Cash at bank and short-term investments of US$151m (2007: US$907m) are further analysed by external credit rating
where a balance with the counterparty is greater than US$2m:
2008 2007
US$m US$m
A rated 44 852
B rated 58 6
Counterparty holding of less than US$2m 49 49
151 907
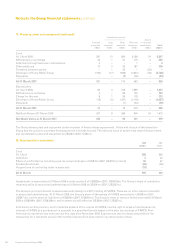
23. Trade and other payables
Current Non-current Current Non-current
2008 2008 2007 2007
US$m US$m US$m US$m
Trade creditors 214 – 193 –
VAT and other taxes payable 52 – 42 –
Social security costs 95 – 75 –
Accruals and deferred income 818 24 653 17
Other creditors 100 33 68 35
1,279 57 1,031 52
There is no material difference between the fair value of trade and other payables and the book value stated above. Non-
current trade and other payables of US$nil (2007: US$1m) are due after more than five years from the balance sheet date.
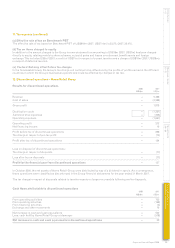
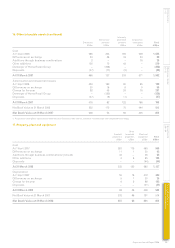
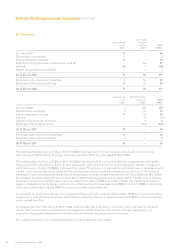
24. Loans and borrowings
(a) The analysis of loans and borrowings disclosed in the Group balance sheet is as follows:
Current Non-current Current Non-current
2008 2008 2007 2007
US$m US$m US$m US$m
€548m 4.125% Euronotes 2007 – – 751 –
£350m 6.375% Eurobonds 2009 – 732 – 721
£334m 5.625% Euronotes 2013 – 660 – 627
Bank loans 29 1,409 – –
Overdrafts 4 – 273 –
Present value of obligations under finance leases (note (d)) 6 10 1 –
39 2,811 1,025 1,348
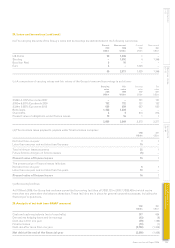
During the year ended 31 March 2008, the whole of the outstanding balance of the 4.125% Euronotes 2007 was repaid on its
maturity at the par value of €548m. This repayment was financed from bank facilities that were in place at 31 March 2007.
During the year ended 31 March 2007, 4.125% Euronotes 2007 with a par value of €20m and 5.625% Euronotes 2013 with a par
value of £16m were redeemed.
The effective interest rate of Euronotes and Eurobonds approximates to the nominal rate indicated above. The effective
interest rate for overdrafts at 31 March 2008 is 4.6% (2007: 4.3%).
Other than finance lease obligations, all the borrowings of the Group shown above are unsecured. Finance lease obligations
are effectively secured as the rights to the leased assets revert to the lessor in the event of default.
Notes to the Group financial statements continued