Experian 2008 Annual Report Download - page 112
Download and view the complete annual report
Please find page 112 of the 2008 Experian annual report below. You can navigate through the pages in the report by either clicking on the pages listed below, or by using the keyword search tool below to find specific information within the annual report.-
 1
1 -
2
-
3
-
4
-
5
-
6
-
7
-
8
-
9
-
10
-
11
-
12
-
13
-
14
-
15
-
16
-
17
-
18
-
19
-
20
-
21
-
22
-
23
-
24
-
25
-
26
-
27
-
28
-
29
-
30
-
31
-
32
-
33
-
34
-
35
-
36
-
37
-
38
-
39
-
40
-
41
-
42
-
43
-
44
-
45
-
46
-
47
-
48
-
49
-
50
-
51
-
52
-
53
-
54
-
55
-
56
-
57
-
58
-
59
-
60
-
61
-
62
-
63
-
64
-
65
-
66
-
67
-
68
-
69
-
70
-
71
-
72
-
73
-
74
-
75
-
76
-
77
-
78
-
79
-
80
-
81
-
82
-
83
-
84
-
85
-
86
-
87
-
88
-
89
-
90
-
91
-
92
-
93
-
94
-
95
-
96
-
97
-
98
-
99
-
100
-
101
-
 102
102 -
 103
103 -
 104
104 -
 105
105 -
 106
106 -
 107
107 -
 108
108 -
 109
109 -
 110
110 -
 111
111 -
 112
112 -
 113
113 -
 114
114 -
 115
115 -
 116
116 -
 117
117 -
 118
118 -
 119
119 -
 120
120 -
 121
121 -
 122
122 -
123
-
124
-
125
-
126
-
127
-
128
-
129
-
130
-
131
-
132
-
133
-
134
-
135
-
136
-
137
-
138
-
139
-
140
-
141
-
142
-
143
-
144
-
145
-
146
-
147
-
148
 |
 |

110 Experian Annual Report 2008
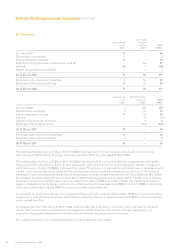
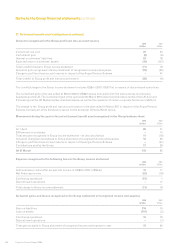
27. Retirement benefit assets/obligations (continued)
Actuarial assumptions
The valuations used for 31 March 2008 have been based on the most recent actuarial valuations, updated by
Watson Wyatt Limited to take account of the requirements of IAS 19. The principal actuarial assumptions used
to calculate the present value of the defined benefit obligations were as follows:
2008 2007
% %
Rate of inflation 3.6 3.1
Rate of increase for salaries 5.4 4.9
Rate of increase for pensions in payment and deferred pensions 3.6 3.1
Rate of increase for medical costs 6.5 6.5
Discount rate 6.9 5.4
The main financial assumption is the real discount rate, i.e. the excess of the discount rate over the rate of inflation. If this
assumption increased/decreased by 0.1%, the defined benefit obligation would decrease/increase by approximately US$15m
and the annual current service cost would decrease/increase by approximately US$1m. The discount rate is based on the
market yields on high quality corporate bonds of appropriate currency and term to the defined benefit obligations.
The IAS 19 valuation assumes that mortality will be in line with the PA92 series year of use tables with medium cohort
mortality improvement projections and an age rating of +1 year. This includes an explicit allowance for anticipated future
improvements in life expectancy (medium cohort projections).
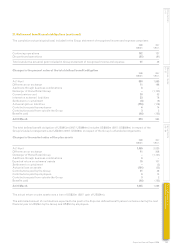
The average expectation of life on retirement in normal health is assumed to be:
2008 2007
years years
At age 65 for a male currently aged 65 21.2 19.1
At age 65 for a female currently aged 65 24.1 22.2
At age 65 for a male currently aged 50 22.2 19.8
At age 65 for a female currently aged 50 25.0 23.1
An increase in assumed life expectancy of 0.1 years would increase the defined benefit obligation at 31 March 2008 by
approximately US$3m.
The assumptions in respect of discount rate, salary increases and mortality all have a significant effect on the IAS 19
accounting valuation. Changes to these assumptions in the light of prevailing conditions may have a significant impact on
future valuations.
The IAS 19 valuation, in respect of post-retirement healthcare insurance benefits provided to certain former Group
employees, additionally assumes a rate of increase for medical costs. If this assumption increased/decreased by 1.0% per
annum then the obligation would increase/decrease by US$1m and the current service cost would remain unchanged.
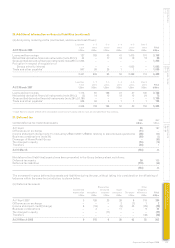
Assets of the Group’s defined benefit schemes and their expected rates of return
Expected Expected
long-term long-term
rate of rate of
Fair value return Fair value return
2008 2008 2007 2007
US$m %p.a. US$m %p.a.
Equities 693 9.1 733 8.1
Fixed interest securities 343 5.7 336 5.4
Other 9 5.1 – n/a
1,045 8.0 1,069 7.3
The expected return on plan assets has been determined by considering the mix of returns anticipated on the assets held
in accordance with the current investment policy. Expected yields on fixed interest investments and securities are based on
gross redemption yields as at the balance sheet date. Expected returns on equity and other investments reflect the long-term
real rates of return experienced in the respective markets.
Notes to the Group financial statements continued