Experian 2008 Annual Report Download - page 24
Download and view the complete annual report
Please find page 24 of the 2008 Experian annual report below. You can navigate through the pages in the report by either clicking on the pages listed below, or by using the keyword search tool below to find specific information within the annual report.-
 1
1 -
2
-
3
-
4
-
5
-
6
-
7
-
8
-
9
-
10
-
11
-
12
-
13
-
 14
14 -
 15
15 -
 16
16 -
 17
17 -
 18
18 -
 19
19 -
 20
20 -
 21
21 -
 22
22 -
 23
23 -
 24
24 -
 25
25 -
 26
26 -
 27
27 -
 28
28 -
 29
29 -
 30
30 -
 31
31 -
 32
32 -
 33
33 -
 34
34 -
35
-
36
-
37
-
38
-
39
-
40
-
41
-
42
-
43
-
44
-
45
-
46
-
47
-
48
-
49
-
50
-
51
-
52
-
53
-
54
-
55
-
56
-
57
-
58
-
59
-
60
-
61
-
62
-
63
-
64
-
65
-
66
-
67
-
68
-
69
-
70
-
71
-
72
-
73
-
74
-
75
-
76
-
77
-
78
-
79
-
80
-
81
-
82
-
83
-
84
-
85
-
86
-
87
-
88
-
89
-
90
-
91
-
92
-
93
-
94
-
95
-
96
-
97
-
98
-
99
-
100
-
101
-
102
-
103
-
104
-
105
-
106
-
107
-
108
-
109
-
110
-
111
-
112
-
113
-
114
-
115
-
116
-
117
-
118
-
119
-
120
-
121
-
122
-
123
-
124
-
125
-
126
-
127
-
128
-
129
-
130
-
131
-
132
-
133
-
134
-
135
-
136
-
137
-
138
-
139
-
140
-
141
-
142
-
143
-
144
-
145
-
146
-
147
-
148
 |
 |

22 Experian Annual Report 2008
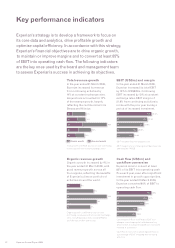
Revenue
Group revenue from continuing
operations grew by 18.6% from
US$3,481m to US$4,130m.
Benchmark profit before tax
(‘Benchmark PBT’)
Benchmark PBT for continuing
operations rose by US$105m to
US$819m, principally as a result of
the increase in revenue from
continuing operations including the
benefit of acquisitions.
Taxation
The Group’s effective rate of tax for
the year based on Benchmark PBT
was 23.2% (2007: 22.4%). The Group’s
cash tax rate (based on tax paid in the
year and Benchmark PBT) was 11.1%
(2007: 16.9%).
Earnings and dividends
per share
Basic earnings per share were 43.3 US
cents in the year ended 31 March 2008.
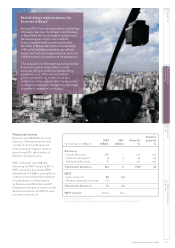
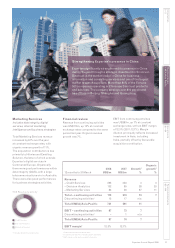
Bringing new confidence to the buying
of used cars
Experian’s vehicle history information is a
vital component in the used car buying and
selling process. It reveals if a vehicle has
been stolen or previously salvaged, whether
it has been water damaged or involved in an
accident, whether the mileage is correct and
other valuable insights.
Interpreting all this information can be time
consuming though, particularly for people
wanting to compare different vehicles
quickly and easily. That’s why Experian has
developed the AutoCheck Score in the US,
a world first for the vehicle industry. The
AutoCheck Score distills all the history
information Experian holds on a vehicle into
a single, numeric score and then compares
it to vehicles of similar age and type. The
AutoCheck Score is a valuable tool for
used car buyers and sellers, and has been
proven to increase confidence in the vehicle
purchase decision.
Financial review
The Group made sound financial progress in the year
with good revenue, profit and cash performance.