Experian 2008 Annual Report Download - page 91
Download and view the complete annual report
Please find page 91 of the 2008 Experian annual report below. You can navigate through the pages in the report by either clicking on the pages listed below, or by using the keyword search tool below to find specific information within the annual report.-
 1
1 -
2
-
3
-
4
-
5
-
6
-
7
-
8
-
9
-
10
-
11
-
12
-
13
-
14
-
15
-
16
-
17
-
18
-
19
-
20
-
21
-
22
-
23
-
24
-
25
-
26
-
27
-
28
-
29
-
30
-
31
-
32
-
33
-
34
-
35
-
36
-
37
-
38
-
39
-
40
-
41
-
42
-
43
-
44
-
45
-
46
-
47
-
48
-
49
-
50
-
51
-
52
-
53
-
54
-
55
-
56
-
57
-
58
-
59
-
60
-
61
-
62
-
63
-
64
-
65
-
66
-
67
-
68
-
69
-
70
-
71
-
72
-
73
-
74
-
75
-
76
-
77
-
78
-
79
-
80
-
 81
81 -
 82
82 -
 83
83 -
 84
84 -
 85
85 -
 86
86 -
 87
87 -
 88
88 -
 89
89 -
 90
90 -
 91
91 -
 92
92 -
 93
93 -
 94
94 -
 95
95 -
 96
96 -
 97
97 -
 98
98 -
 99
99 -
 100
100 -
 101
101 -
102
-
103
-
104
-
105
-
106
-
107
-
108
-
109
-
110
-
111
-
112
-
113
-
114
-
115
-
116
-
117
-
118
-
119
-
120
-
121
-
122
-
123
-
124
-
125
-
126
-
127
-
128
-
129
-
130
-
131
-
132
-
133
-
134
-
135
-
136
-
137
-
138
-
139
-
140
-
141
-
142
-
143
-
144
-
145
-
146
-
147
-
148
 |
 |

89Experian Annual Report 2008
Introduction
2 – 5
Business review
6 – 37
Governance
38 – 64
Financial statements
Group financial statements
Financial statements
Group financial statements
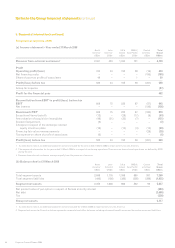
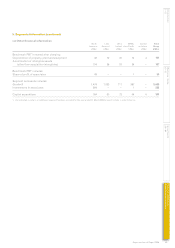
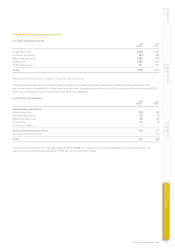
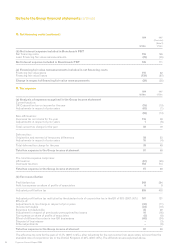
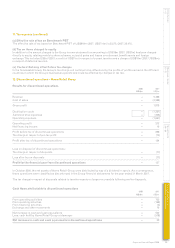
5. Segmental information (continued)
(b) Total segment assets
2008 2007
US$m US$m
Credit Services 3,759 1,871
Decision Analytics 494 293
Marketing Services 1,323 993
Interactive 1,082 1,131
Central activities 611 614
To t a l 7,269 4,902
Total segment assets are in respect of continuing operations.
Total segment assets for Central activities represent corporate head office balances including retirement benefit and
derivative assets. In addition to those assets reflected in the geographical analysis, all Group properties are included within
Central activities as they are not allocated by business segment.
(c) Capital expenditure
2008 2007
US$m US$m
Continuing operations
Credit Services 238 182
Decision Analytics 23 9
Marketing Services 58 64
Interactive 21 20
Central activities 4 –
Total continuing operations 344 275
Discontinued operations – 173
Total 344 448
Total capital expenditure for the year ended 31 March 2008 is in respect of continuing operations only as there were no
discontinued operations as defined by IFRS during the year then ended.