Experian 2008 Annual Report Download - page 113
Download and view the complete annual report
Please find page 113 of the 2008 Experian annual report below. You can navigate through the pages in the report by either clicking on the pages listed below, or by using the keyword search tool below to find specific information within the annual report.-
 1
1 -
2
-
3
-
4
-
5
-
6
-
7
-
8
-
9
-
10
-
11
-
12
-
13
-
14
-
15
-
16
-
17
-
18
-
19
-
20
-
21
-
22
-
23
-
24
-
25
-
26
-
27
-
28
-
29
-
30
-
31
-
32
-
33
-
34
-
35
-
36
-
37
-
38
-
39
-
40
-
41
-
42
-
43
-
44
-
45
-
46
-
47
-
48
-
49
-
50
-
51
-
52
-
53
-
54
-
55
-
56
-
57
-
58
-
59
-
60
-
61
-
62
-
63
-
64
-
65
-
66
-
67
-
68
-
69
-
70
-
71
-
72
-
73
-
74
-
75
-
76
-
77
-
78
-
79
-
80
-
81
-
82
-
83
-
84
-
85
-
86
-
87
-
88
-
89
-
90
-
91
-
92
-
93
-
94
-
95
-
96
-
97
-
98
-
99
-
100
-
101
-
102
-
 103
103 -
 104
104 -
 105
105 -
 106
106 -
 107
107 -
 108
108 -
 109
109 -
 110
110 -
 111
111 -
 112
112 -
 113
113 -
 114
114 -
 115
115 -
 116
116 -
 117
117 -
 118
118 -
 119
119 -
 120
120 -
 121
121 -
 122
122 -
 123
123 -
124
-
125
-
126
-
127
-
128
-
129
-
130
-
131
-
132
-
133
-
134
-
135
-
136
-
137
-
138
-
139
-
140
-
141
-
142
-
143
-
144
-
145
-
146
-
147
-
148
 |
 |

111Experian Annual Report 2008
Introduction
2 – 5
Business review
6 – 37
Governance
38 – 64
Financial statements
Group financial statements
Financial statements
Group financial statements
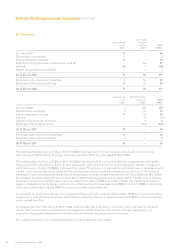
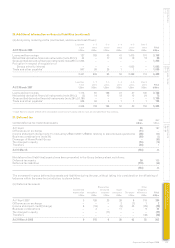
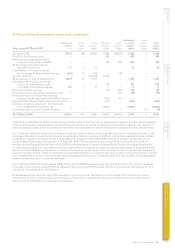
27. Retirement benefit assets/obligations (continued)
History of experience gains and losses
2008 2007 2006 2005
US$m US$m US$m US$m
Present value of defined benefit obligation (913) (984) (1,989) (2,025)
Fair value of schemes’ assets 1,045 1,069 2,020 1,814
Net pension asset/(obligation) 132 85 31 (211)
2008 2007 2006 2005
Experience adjustment arising on defined benefit obligation:
Amount – Loss/(gain) (US$m) 8 (5) 2 (110)
Percentage of the present value of defined benefit obligation 0.9% 0.5% – 5.4%
Experience adjustment arising on schemes’ assets:
Amount – Loss/(gain) (US$m) 101 53 (241) –
Percentage of schemes’ assets 9.7% 5.1% 11.6% –
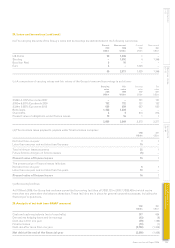
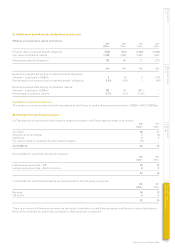
(b) Defined contribution schemes
The pension cost represents contributions payable by the Group to such schemes and amounted to US$37m (2007: US$33m).
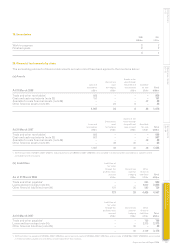
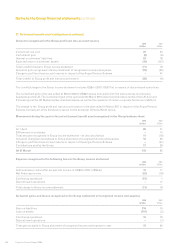
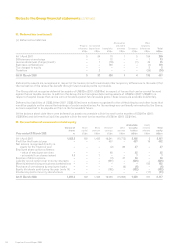
28. Available for sale financial assets
(a) The analysis of available for sale financial assets disclosed in the Group balance sheet is as follows:
2008 2007
US$m US$m
At 1 April 38 37
Differences on exchange 1 (2)
Additions 4 3
Fair value losses on available for sale financial assets (1) –
At 31 March 42 38
(b) Available for sale financial assets comprise:
2008 2007
US$m US$m
Listed equity securities – UK 34 29
Listed equity securities – North America 8 9
42 38
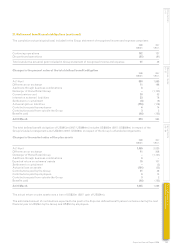
(c) Available for sale financial assets are denominated in the following currencies:
2008 2007
US$m US$m
Sterling 34 29
US Dollar 8 9
42 38
There is no material difference between the fair value of available for sale financial assets and the book value stated above.
None of the available for sale financial assets is either past due or impaired.