Experian 2008 Annual Report Download - page 34
Download and view the complete annual report
Please find page 34 of the 2008 Experian annual report below. You can navigate through the pages in the report by either clicking on the pages listed below, or by using the keyword search tool below to find specific information within the annual report.-
 1
1 -
2
-
3
-
4
-
5
-
6
-
7
-
8
-
9
-
10
-
11
-
12
-
13
-
14
-
15
-
16
-
17
-
18
-
19
-
20
-
21
-
22
-
23
-
 24
24 -
 25
25 -
 26
26 -
 27
27 -
 28
28 -
 29
29 -
 30
30 -
 31
31 -
 32
32 -
 33
33 -
 34
34 -
 35
35 -
 36
36 -
 37
37 -
 38
38 -
 39
39 -
 40
40 -
 41
41 -
 42
42 -
 43
43 -
 44
44 -
45
-
46
-
47
-
48
-
49
-
50
-
51
-
52
-
53
-
54
-
55
-
56
-
57
-
58
-
59
-
60
-
61
-
62
-
63
-
64
-
65
-
66
-
67
-
68
-
69
-
70
-
71
-
72
-
73
-
74
-
75
-
76
-
77
-
78
-
79
-
80
-
81
-
82
-
83
-
84
-
85
-
86
-
87
-
88
-
89
-
90
-
91
-
92
-
93
-
94
-
95
-
96
-
97
-
98
-
99
-
100
-
101
-
102
-
103
-
104
-
105
-
106
-
107
-
108
-
109
-
110
-
111
-
112
-
113
-
114
-
115
-
116
-
117
-
118
-
119
-
120
-
121
-
122
-
123
-
124
-
125
-
126
-
127
-
128
-
129
-
130
-
131
-
132
-
133
-
134
-
135
-
136
-
137
-
138
-
139
-
140
-
141
-
142
-
143
-
144
-
145
-
146
-
147
-
148
 |
 |

32 Experian Annual Report 2008
Organic growth Acquired growth
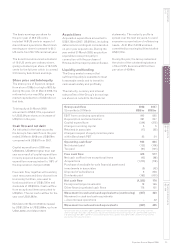
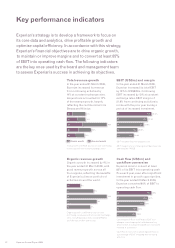
Key performance indicators
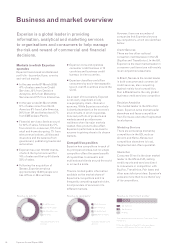
Experian’s strategy is to develop a framework to focus on
its core data and analytics, drive profitable growth and
optimise capital efficiency. In accordance with this strategy,
Experian’s financial objectives are to drive organic growth,
to maintain or improve margins and to convert at least 85%
of EBIT into operating cash flow. The following indicators
are the key ones used by the board and management team
to assess Experian’s success in achieving its objectives.
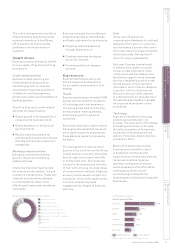
EBIT (US$m) and margin
In the year ended 31 March 2008,
Experian increased its total EBIT
by 15% to US$945m. Continuing
EBIT increased by 13% at constant
exchange rates. EBIT margin of
21.8% from continuing activities is
in line with the prior year during a
period of increased investment.
Total revenue growth
In the year ended 31 March 2008,
Experian increased its revenue
from continuing activities by
14% at constant exchange rates.
Acquisitions accounted for 10%
of the revenue growth, largely
reflecting the contributions from
Serasa and Hitwise.
30%
18%
Organic growth Acquired growth
08
07
06
05
04
14%
13%
14%
Total growth is defined as year-on-year continuing
revenue growth at constant exchange rates
21.8%
08 945
07 825
06 727
05 567
04 457
21.9%
21.0%
20.0%
19.6%
EBIT includes discontinuing activities
EBIT margin is for continuing direct business only
and excludes FARES
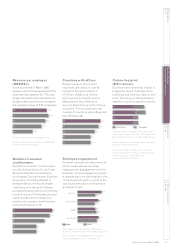
Organic revenue growth
Organic growth increased by 4% in
the year ended 31 March 2008, with
good revenue growth across all
four regions, reflecting the benefits
of Experian’s diverse portfolio of
activities around the world.
4%
08
07
06
05
04
8%
12%
9%
7%
Organic growth is defined as year-on-year
continuing revenue growth at constant exchange
rates, excluding acquisitions except affiliates,
until the date of their anniversary
Cash flow (US$m) and
cash flow conversion
Experian aims to convert at least
85% of its EBIT into operating cash
flow each year, even after significant
investment in growth opportunities.
In the year ended 31 March 2008,
Experian converted 95% of EBIT to
operating cash flow.
95%
08 902
07 804
06 717
05 535
04 495
97%
99%
94%
108%
Operating cash flow is defined as EBIT less
changes in working capital, add depreciation/
amortisation, less capital expenditure, less profit
retained in associates
Cash flow conversion is operating cash flow as
a percentage of EBIT including discontinuing
activities