Experian 2008 Annual Report Download - page 93
Download and view the complete annual report
Please find page 93 of the 2008 Experian annual report below. You can navigate through the pages in the report by either clicking on the pages listed below, or by using the keyword search tool below to find specific information within the annual report.-
 1
1 -
2
-
3
-
4
-
5
-
6
-
7
-
8
-
9
-
10
-
11
-
12
-
13
-
14
-
15
-
16
-
17
-
18
-
19
-
20
-
21
-
22
-
23
-
24
-
25
-
26
-
27
-
28
-
29
-
30
-
31
-
32
-
33
-
34
-
35
-
36
-
37
-
38
-
39
-
40
-
41
-
42
-
43
-
44
-
45
-
46
-
47
-
48
-
49
-
50
-
51
-
52
-
53
-
54
-
55
-
56
-
57
-
58
-
59
-
60
-
61
-
62
-
63
-
64
-
65
-
66
-
67
-
68
-
69
-
70
-
71
-
72
-
73
-
74
-
75
-
76
-
77
-
78
-
79
-
80
-
81
-
82
-
 83
83 -
 84
84 -
 85
85 -
 86
86 -
 87
87 -
 88
88 -
 89
89 -
 90
90 -
 91
91 -
 92
92 -
 93
93 -
 94
94 -
 95
95 -
 96
96 -
 97
97 -
 98
98 -
 99
99 -
 100
100 -
 101
101 -
 102
102 -
 103
103 -
104
-
105
-
106
-
107
-
108
-
109
-
110
-
111
-
112
-
113
-
114
-
115
-
116
-
117
-
118
-
119
-
120
-
121
-
122
-
123
-
124
-
125
-
126
-
127
-
128
-
129
-
130
-
131
-
132
-
133
-
134
-
135
-
136
-
137
-
138
-
139
-
140
-
141
-
142
-
143
-
144
-
145
-
146
-
147
-
148
 |
 |

91Experian Annual Report 2008
Introduction
2 – 5
Business review
6 – 37
Governance
38 – 64
Financial statements
Group financial statements
Financial statements
Group financial statements
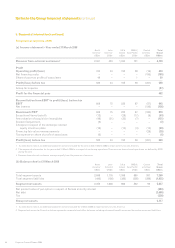
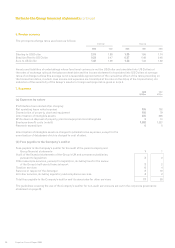
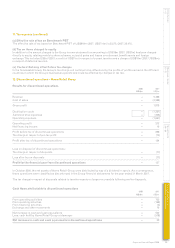
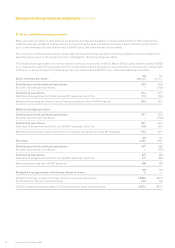
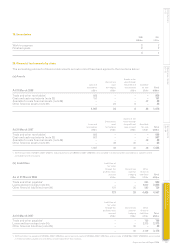
8. Employee benefit costs and employee numbers
Aggregate employee costs for the continuing operations of the Group
2008 2007
Notes US$m US$m
Wages and salaries 1,249 1,025
Social security costs 208 161
Share-based payments 35 76 91
Pension costs – defined benefit plans 27 12 17
Pension costs – defined contribution plans 27 37 33
Total continuing operations 1,582 1,327
Average number of employees (including executive directors) in the continuing operations of the Group
2008 2007
Full time Full time
Full time Part time equivalent Full time Part time equivalent
North America 5,674 286 5,817 5,190 201 5,290
Latin America 1,846 258 1,975 40 – 40
UK & Ireland 4,004 205 4,106 3,745 189 3,840
EMEA/Asia Pacific 3,667 220 3,777 3,248 226 3,361
Central activities 80 3 82 95 4 97
Total continuing operations 15,271 972 15,757 12,318 620 12,628
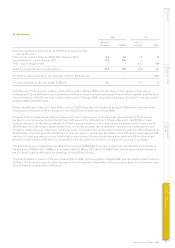
As indicated in note 2, an additional segment has been included for the year ended 31 March 2008 to report activity in
Latin America and comparative figures have been restated. The average number of employees (full time equivalent)
of Serasa in the nine months since acquisition is 2,505; the employee numbers in respect of Serasa reported within
Latin America have been adjusted to reflect the period of ownership.
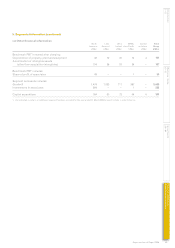
Remuneration of key management personnel
2008 2007
US$m US$m
Salaries and short-term employee benefits 12 16
Retirement benefits 5 4
Share-based payments 18 28
Total continuing operations 35 48
Key management personnel comprises the board of directors, shown on pages 38 and 39, and certain senior management.
The amount included in respect of share-based payments includes operating and exceptional costs for previous GUS awards
and the one-off demerger awards.
Further details of the remuneration of directors are given in the audited part of the report on directors’ remuneration on
pages 58 to 63.