Experian 2008 Annual Report Download - page 103
Download and view the complete annual report
Please find page 103 of the 2008 Experian annual report below. You can navigate through the pages in the report by either clicking on the pages listed below, or by using the keyword search tool below to find specific information within the annual report.-
 1
1 -
2
-
3
-
4
-
5
-
6
-
7
-
8
-
9
-
10
-
11
-
12
-
13
-
14
-
15
-
16
-
17
-
18
-
19
-
20
-
21
-
22
-
23
-
24
-
25
-
26
-
27
-
28
-
29
-
30
-
31
-
32
-
33
-
34
-
35
-
36
-
37
-
38
-
39
-
40
-
41
-
42
-
43
-
44
-
45
-
46
-
47
-
48
-
49
-
50
-
51
-
52
-
53
-
54
-
55
-
56
-
57
-
58
-
59
-
60
-
61
-
62
-
63
-
64
-
65
-
66
-
67
-
68
-
69
-
70
-
71
-
72
-
73
-
74
-
75
-
76
-
77
-
78
-
79
-
80
-
81
-
82
-
83
-
84
-
85
-
86
-
87
-
88
-
89
-
90
-
91
-
92
-
 93
93 -
 94
94 -
 95
95 -
 96
96 -
 97
97 -
 98
98 -
 99
99 -
 100
100 -
 101
101 -
 102
102 -
 103
103 -
 104
104 -
 105
105 -
 106
106 -
 107
107 -
 108
108 -
 109
109 -
 110
110 -
 111
111 -
 112
112 -
 113
113 -
114
-
115
-
116
-
117
-
118
-
119
-
120
-
121
-
122
-
123
-
124
-
125
-
126
-
127
-
128
-
129
-
130
-
131
-
132
-
133
-
134
-
135
-
136
-
137
-
138
-
139
-
140
-
141
-
142
-
143
-
144
-
145
-
146
-
147
-
148
 |
 |

101Experian Annual Report 2008
Introduction
2 – 5
Business review
6 – 37
Governance
38 – 64
Financial statements
Group financial statements
Financial statements
Group financial statements
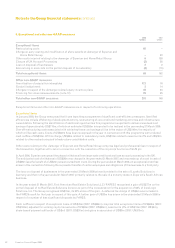
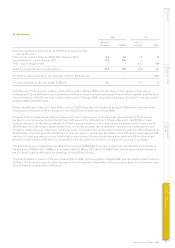
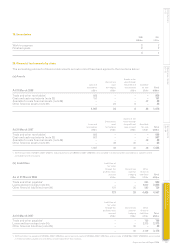
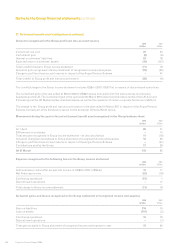
19. Inventories
2008 2007
US$m US$m
Work in progress 2 2
Finished goods 2 2
4 4
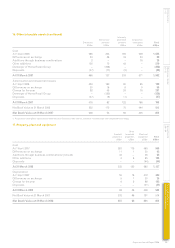
20. Financial instruments by class
The accounting policies for financial instruments set out in note 2 have been applied to the line items below:
(a) Assets
Assets at fair
Derivatives value through
Loan and used the profit and Available
receivables for hedging loss account for sale To t a l
At 31 March 2008 US$m US$m US$m US$m US$m
Trade and other receivables1 856 – – – 856
Cash and cash equivalents (note 22) 151 – – – 151
Available for sale financial assets (note 28) – – – 42 42
Other financial assets (note 29) – 24 6 – 30
1,007 24 6 42 1,079
Assets at fair
Derivatives value through
Loan and used the profit and Available
receivables for hedging loss account for sale To t a l
At 31 March 2007 US$m US$m US$m US$m US$m
Trade and other receivables1 660 – – – 660
Cash and cash equivalents (note 22) 907 – – – 907
Available for sale financial assets (note 28) – – – 38 38
Other financial assets (note 29) – 49 40 – 89
1,567 49 40 38 1,694
1. VAT recoverable of US$1m (2007: US$1m) and prepayments of US$183m (2007: US$144m) are included in trade and other receivables in note 21 but are
excluded from this analysis.
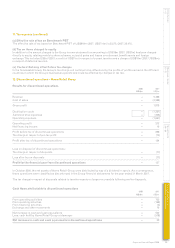
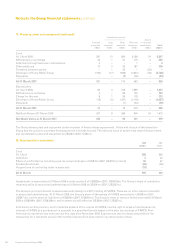
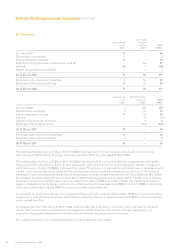
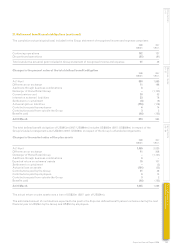
(b) Liabilities Liabilities at
fair value
through the Derivatives Other
profit and loss used for financial
account hedging liabilities To t a l
As at 31 March 2008 US$m US$m US$m US$m
Trade and other payables1 – – 993 993
Loans and borrowings (note 24) – – 2,850 2,850
Other financial liabilities (note 29) 121 20 583 724
121 20 4,426 4,567
Liabilities at
fair value
through the Derivatives Other
profit and loss used for financial
account hedging liabilities To t a l
At 31 March 2007 US$m US$m US$m US$m
Trade and other payables1 – – 766 766
Loans and borrowings (note 24) – – 2,373 2,373
Other financial liabilities (note 29) – 40 – 40
– 40 3,139 3,179
1. VAT and other tax payable of US$52m (2007: US$42m), social security costs of US$95m (2007: US$75m) and accruals of US$196m (2007: US$200m) are included
in trade and other payables in note 23 but are excluded from this analysis.