Experian 2008 Annual Report Download - page 87
Download and view the complete annual report
Please find page 87 of the 2008 Experian annual report below. You can navigate through the pages in the report by either clicking on the pages listed below, or by using the keyword search tool below to find specific information within the annual report.-
 1
1 -
2
-
3
-
4
-
5
-
6
-
7
-
8
-
9
-
10
-
11
-
12
-
13
-
14
-
15
-
16
-
17
-
18
-
19
-
20
-
21
-
22
-
23
-
24
-
25
-
26
-
27
-
28
-
29
-
30
-
31
-
32
-
33
-
34
-
35
-
36
-
37
-
38
-
39
-
40
-
41
-
42
-
43
-
44
-
45
-
46
-
47
-
48
-
49
-
50
-
51
-
52
-
53
-
54
-
55
-
56
-
57
-
58
-
59
-
60
-
61
-
62
-
63
-
64
-
65
-
66
-
67
-
68
-
69
-
70
-
71
-
72
-
73
-
74
-
75
-
76
-
 77
77 -
 78
78 -
 79
79 -
 80
80 -
 81
81 -
 82
82 -
 83
83 -
 84
84 -
 85
85 -
 86
86 -
 87
87 -
 88
88 -
 89
89 -
 90
90 -
 91
91 -
 92
92 -
 93
93 -
 94
94 -
 95
95 -
 96
96 -
 97
97 -
98
-
99
-
100
-
101
-
102
-
103
-
104
-
105
-
106
-
107
-
108
-
109
-
110
-
111
-
112
-
113
-
114
-
115
-
116
-
117
-
118
-
119
-
120
-
121
-
122
-
123
-
124
-
125
-
126
-
127
-
128
-
129
-
130
-
131
-
132
-
133
-
134
-
135
-
136
-
137
-
138
-
139
-
140
-
141
-
142
-
143
-
144
-
145
-
146
-
147
-
148
 |
 |

85Experian Annual Report 2008
Introduction
2 – 5
Business review
6 – 37
Governance
38 – 64
Financial statements
Group financial statements
Financial statements
Group financial statements
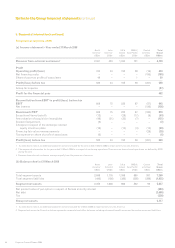
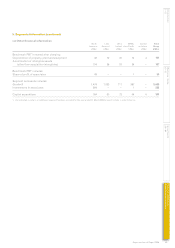
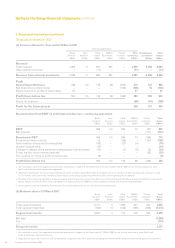
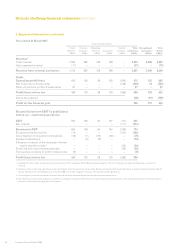
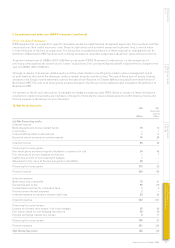
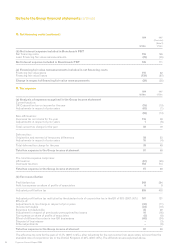
5. Segmental information (continued)
(c) Other financial information
North Latin UK & EMEA/ Central To t a l
America1 America1 Ireland Asia Pacific activities Group
US$m US$m US$m US$m US$m US$m
Benchmark PBT is stated after charging:
Depreciation of property, plant and equipment 42 12 30 14 3 101
Amortisation of intangible assets
(other than acquisition intangibles) 104 26 33 24 – 187
Benchmark PBT includes:
Share of profit of associates 49 – – 1 – 50
Segment net assets includes:
Goodwill 1,474 1,033 711 387 – 3,605
Investments in associates 294 – – 1 – 295
Capital expenditure 164 50 72 54 4 344
1. As indicated in note 2, an additional segment has been included for the year ended 31 March 2008 to report activity in Latin America.