Experian 2008 Annual Report Download - page 69
Download and view the complete annual report
Please find page 69 of the 2008 Experian annual report below. You can navigate through the pages in the report by either clicking on the pages listed below, or by using the keyword search tool below to find specific information within the annual report.-
 1
1 -
2
-
3
-
4
-
5
-
6
-
7
-
8
-
9
-
10
-
11
-
12
-
13
-
14
-
15
-
16
-
17
-
18
-
19
-
20
-
21
-
22
-
23
-
24
-
25
-
26
-
27
-
28
-
29
-
30
-
31
-
32
-
33
-
34
-
35
-
36
-
37
-
38
-
39
-
40
-
41
-
42
-
43
-
44
-
45
-
46
-
47
-
48
-
49
-
50
-
51
-
52
-
53
-
54
-
55
-
56
-
57
-
58
-
 59
59 -
 60
60 -
 61
61 -
 62
62 -
 63
63 -
 64
64 -
 65
65 -
 66
66 -
 67
67 -
 68
68 -
 69
69 -
 70
70 -
 71
71 -
 72
72 -
 73
73 -
 74
74 -
 75
75 -
 76
76 -
 77
77 -
 78
78 -
 79
79 -
80
-
81
-
82
-
83
-
84
-
85
-
86
-
87
-
88
-
89
-
90
-
91
-
92
-
93
-
94
-
95
-
96
-
97
-
98
-
99
-
100
-
101
-
102
-
103
-
104
-
105
-
106
-
107
-
108
-
109
-
110
-
111
-
112
-
113
-
114
-
115
-
116
-
117
-
118
-
119
-
120
-
121
-
122
-
123
-
124
-
125
-
126
-
127
-
128
-
129
-
130
-
131
-
132
-
133
-
134
-
135
-
136
-
137
-
138
-
139
-
140
-
141
-
142
-
143
-
144
-
145
-
146
-
147
-
148
 |
 |

67Experian Annual Report 2008
Introduction
2 – 5
Business review
6 – 37
Governance
38 – 64
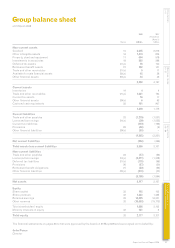
Financial statements
Group financial statements
Financial statements
Group financial statements
2008 2007
(Restated)
(Note 2)
Notes US$m US$m
Non-current assets
Goodwill 15 3,605 2,219
Other intangible assets 16 1,473 804
Property, plant and equipment 17 604 519
Investments in associates 18 295 286
Deferred tax assets 31(a) 26 103
Retirement benefit assets 27 182 141
Trade and other receivables 21(a) 9 11
Available for sale financial assets 28(a) 42 38
Other financial assets 29(a) 24 36
6,260 4,157
Current assets
Inventories 19 4 4
Trade and other receivables 21(a) 1,031 794
Current tax assets 16 17
Other financial assets 29(a) 6 53
Cash and cash equivalents 22 151 907
1,208 1,775
Current liabilities
Trade and other payables 23 (1,279) (1,031)
Loans and borrowings 24(a) (39) (1,025)
Current tax liabilities (110) (166)
Provisions 26 (84) (9)
Other financial liabilities 29(a) (50) –
(1,562) (2,231)
Net current liabilities (354) (456)
Total assets less current liabilities 5,906 3,701
Non-current liabilities
Trade and other payables 23 (57) (52)
Loans and borrowings 24(a) (2,811) (1,348)
Deferred tax liabilities 31(a) (170) (68)
Provisions 26 (27) (30)
Retirement benefit obligations 27 (50) (56)
Other financial liabilities 29(a) (674) (40)
(3,789) (1,594)
Net assets 2,117 2,107
Equity
Share capital 32 102 102
Share premium 32 1,442 1,435
Retained earnings 32 16,065 16,341
Other reserves 32 (15,653) (15,773)
Total shareholders’ equity 1,956 2,105
Minority interests in equity 32 161 2
Total equity 32 2,117 2,107
The financial statements on pages 66 to 130 were approved by the board on 20 May 2008 and were signed on its behalf by:
John Peace
Director
Group balance sheet
at 31 March 2008