Experian 2008 Annual Report Download - page 96
Download and view the complete annual report
Please find page 96 of the 2008 Experian annual report below. You can navigate through the pages in the report by either clicking on the pages listed below, or by using the keyword search tool below to find specific information within the annual report.-
 1
1 -
2
-
3
-
4
-
5
-
6
-
7
-
8
-
9
-
10
-
11
-
12
-
13
-
14
-
15
-
16
-
17
-
18
-
19
-
20
-
21
-
22
-
23
-
24
-
25
-
26
-
27
-
28
-
29
-
30
-
31
-
32
-
33
-
34
-
35
-
36
-
37
-
38
-
39
-
40
-
41
-
42
-
43
-
44
-
45
-
46
-
47
-
48
-
49
-
50
-
51
-
52
-
53
-
54
-
55
-
56
-
57
-
58
-
59
-
60
-
61
-
62
-
63
-
64
-
65
-
66
-
67
-
68
-
69
-
70
-
71
-
72
-
73
-
74
-
75
-
76
-
77
-
78
-
79
-
80
-
81
-
82
-
83
-
84
-
85
-
 86
86 -
 87
87 -
 88
88 -
 89
89 -
 90
90 -
 91
91 -
 92
92 -
 93
93 -
 94
94 -
 95
95 -
 96
96 -
 97
97 -
 98
98 -
 99
99 -
 100
100 -
 101
101 -
 102
102 -
 103
103 -
 104
104 -
 105
105 -
 106
106 -
107
-
108
-
109
-
110
-
111
-
112
-
113
-
114
-
115
-
116
-
117
-
118
-
119
-
120
-
121
-
122
-
123
-
124
-
125
-
126
-
127
-
128
-
129
-
130
-
131
-
132
-
133
-
134
-
135
-
136
-
137
-
138
-
139
-
140
-
141
-
142
-
143
-
144
-
145
-
146
-
147
-
148
 |
 |

94 Experian Annual Report 2008
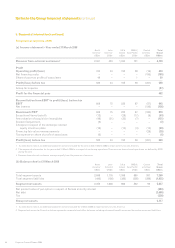
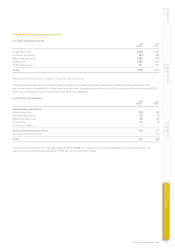
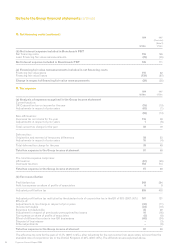
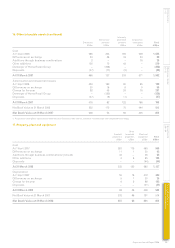
10. Net financing costs (continued)
2008 2007
(Restated)
(Note 2)
US$m US$m
(b) Net interest expense included in Benchmark PBT
Net financing costs 155 146
Less: Financing fair value remeasurements (29) (35)
Net interest expense included in Benchmark PBT 126 111
(c) Financing fair value remeasurements included in net financing costs
Financing fair value gains 110 62
Financing fair value losses (139) (97)
Charge in respect of financing fair value remeasurements (29) (35)
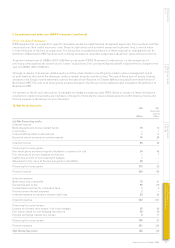
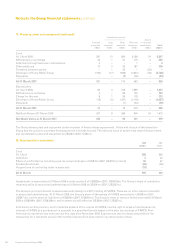
11. Tax expense
2008 2007
US$m US$m
(a) Analysis of expense recognised in the Group income statement
Current taxation:
UK Corporation tax on income for the year (15) (13)
Adjustments in respect of prior years (43) (1)
(58) (14)
Non-UK taxation:
Overseas tax on income for the year 116 39
Adjustments in respect of prior years 1 (6)
Total current tax charge for the year 59 19
Deferred tax:
Origination and reversal of temporary differences 28 53
Adjustments in respect of prior years 10 (4)
Total deferred tax charge for the year 38 49
Total tax expense in the Group income statement 97 68
The total tax expense comprises:
UK taxation (67) (45)
Overseas taxation 164 113
Total tax expense in the Group income statement 97 68
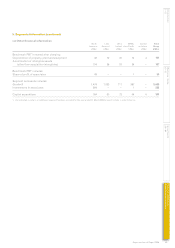
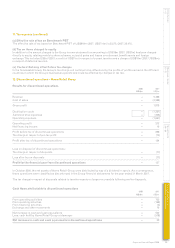
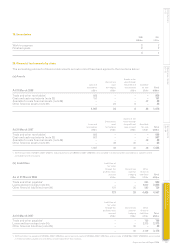
(b) Tax reconciliation
Profit before tax 549 394
Add: tax expense on share of profits of associates 6 9
Adjusted profit before tax 555 403
Adjusted profit before tax multiplied by the standard rate of corporation tax in the UK of 30% (2007: 30%) 167 121
Effects of:
Adjustments to tax charge in respect of prior years (32) (11)
Income not taxable (24) (10)
Expenses not deductible 45 39
Adjustment in respect of previously unrecognised tax losses 10 (16)
Tax expense on share of profits of associates (6) (9)
Effect of different tax rates in non-UK businesses (63) (34)
Disposal of businesses – (3)
Other adjustments – (9)
Total tax expense in the Group income statement 97 68
The effective tax rate for the year of 17.7% (2007: 17.3%), after adjusting for the net income from associates, is lower than the
standard rate of corporation tax in the United Kingdom of 30% (2007: 30%). The differences are explained above.
Notes to the Group financial statements continued