Experian 2008 Annual Report Download - page 88
Download and view the complete annual report
Please find page 88 of the 2008 Experian annual report below. You can navigate through the pages in the report by either clicking on the pages listed below, or by using the keyword search tool below to find specific information within the annual report.-
 1
1 -
2
-
3
-
4
-
5
-
6
-
7
-
8
-
9
-
10
-
11
-
12
-
13
-
14
-
15
-
16
-
17
-
18
-
19
-
20
-
21
-
22
-
23
-
24
-
25
-
26
-
27
-
28
-
29
-
30
-
31
-
32
-
33
-
34
-
35
-
36
-
37
-
38
-
39
-
40
-
41
-
42
-
43
-
44
-
45
-
46
-
47
-
48
-
49
-
50
-
51
-
52
-
53
-
54
-
55
-
56
-
57
-
58
-
59
-
60
-
61
-
62
-
63
-
64
-
65
-
66
-
67
-
68
-
69
-
70
-
71
-
72
-
73
-
74
-
75
-
76
-
77
-
 78
78 -
 79
79 -
 80
80 -
 81
81 -
 82
82 -
 83
83 -
 84
84 -
 85
85 -
 86
86 -
 87
87 -
 88
88 -
 89
89 -
 90
90 -
 91
91 -
 92
92 -
 93
93 -
 94
94 -
 95
95 -
 96
96 -
 97
97 -
 98
98 -
99
-
100
-
101
-
102
-
103
-
104
-
105
-
106
-
107
-
108
-
109
-
110
-
111
-
112
-
113
-
114
-
115
-
116
-
117
-
118
-
119
-
120
-
121
-
122
-
123
-
124
-
125
-
126
-
127
-
128
-
129
-
130
-
131
-
132
-
133
-
134
-
135
-
136
-
137
-
138
-
139
-
140
-
141
-
142
-
143
-
144
-
145
-
146
-
147
-
148
 |
 |

86 Experian Annual Report 2008
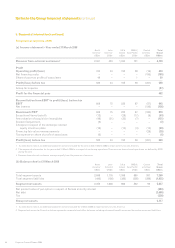
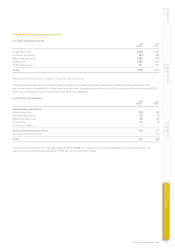
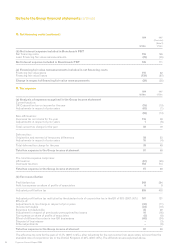
5. Segmental information (continued)
Geographical segments – 2007
(a) Income statement – Year ended 31 March 2007
Continuing operations
North Latin UK & EMEA/ Central Total Discontinued Total
America1 America1 Ireland Asia Pacific activities continuing operations2 Group
US$m US$m US$m US$m US$m US$m US$m US$m
Revenue3
Total revenue 1,989 5 907 591 – 3,492 5,468 8,960
Inter-segment revenue4 – – (11) – – (11) – (11)
Revenue from external customers 1,989 5 896 591 – 3,481 5,468 8,949
Profit
Operating profit/(loss) 436 (4) 176 68 (203) 473 212 685
Net financing income/(costs) – – – – (146) (146) 16 (130)
Share of post-tax profits of associates 67 – – – – 67 – 67
Profit/(loss) before tax 503 (4) 176 68 (349) 394 228 622
Group tax expense (68) (91) (159)
Profit for the financial year 326 137 463
Reconciliation from EBIT to profit/(loss) before tax – continuing operations
North Latin UK & EMEA/ Central To t a l
America1 America1 Ireland Asia Pacific activities Group
US$m US$m US$m US$m US$m US$m
EBIT 566 (4) 236 74 (47) 825
Net interest – – – – (111) (111)
Benchmark PBT 566 (4) 236 74 (158) 714
Exceptional items (note 9) 15 – (26) – (151) (162)
Amortisation of acquisition intangibles (45) – (27) (4) – (76)
Goodwill adjustment (14) – – – – (14)
Charges in respect of the demerger-related equity incentive plans (10) – (7) (2) (5) (24)
Financing fair value remeasurements – – – – (35) (35)
Tax expense on share of profit of associates (9) – – – – (9)
Profit/(loss) before tax 503 (4) 176 68 (349) 394
1. As indicated in note 2, the segmental information presented in respect of the Americas for the year ended 31 March 2007 is now further analysed to show
North and Latin America as separate segments.
2. Additional information on discontinued operations, which comprise Home Retail Group, together with a tax charge in respect of disposals, is shown in note
12. The results of discontinued operations are in respect of businesses operating within the UK & Ireland geographical segment.
3. Revenue from continuing operations arose principally from the provision of services. Revenue from discontinued operations arose principally from the sale of
goods. Revenue within the UK & Ireland geographical segment includes US$11m of inter-segment revenue with discontinued operations.
4. Inter-segment revenue represents the provision of services between Experian and discontinued operations.
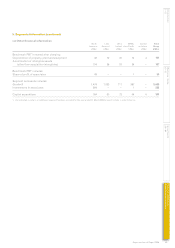
(b) Balance sheet at 31 March 2007
North Latin UK & EMEA/ Central To t a l
America1 America1 Ireland Asia Pacific activities2 Group
US$m US$m US$m US$m US$m US$m
Total segment assets 2,771 5 1,092 614 420 4,902
Total segment liabilities (534) (1) (318) (195) (225) (1,273)
Segment net assets 2,237 4 774 419 195 3,629
Net debt (1,408)
Tax (114)
Group net assets 2,107
1. As indicated in note 2, the segmental information presented in respect of the Americas for 31 March 2007 is now further analysed to show North and
Latin America as separate segments.
2. Segment net assets for Central activities represents corporate head office balances including retirement benefit assets and derivative assets and liabilities.
Notes to the Group financial statements continued