Experian 2008 Annual Report Download - page 28
Download and view the complete annual report
Please find page 28 of the 2008 Experian annual report below. You can navigate through the pages in the report by either clicking on the pages listed below, or by using the keyword search tool below to find specific information within the annual report.-
 1
1 -
2
-
3
-
4
-
5
-
6
-
7
-
8
-
9
-
10
-
11
-
12
-
13
-
14
-
15
-
16
-
17
-
 18
18 -
 19
19 -
 20
20 -
 21
21 -
 22
22 -
 23
23 -
 24
24 -
 25
25 -
 26
26 -
 27
27 -
 28
28 -
 29
29 -
 30
30 -
 31
31 -
 32
32 -
 33
33 -
 34
34 -
 35
35 -
 36
36 -
 37
37 -
 38
38 -
39
-
40
-
41
-
42
-
43
-
44
-
45
-
46
-
47
-
48
-
49
-
50
-
51
-
52
-
53
-
54
-
55
-
56
-
57
-
58
-
59
-
60
-
61
-
62
-
63
-
64
-
65
-
66
-
67
-
68
-
69
-
70
-
71
-
72
-
73
-
74
-
75
-
76
-
77
-
78
-
79
-
80
-
81
-
82
-
83
-
84
-
85
-
86
-
87
-
88
-
89
-
90
-
91
-
92
-
93
-
94
-
95
-
96
-
97
-
98
-
99
-
100
-
101
-
102
-
103
-
104
-
105
-
106
-
107
-
108
-
109
-
110
-
111
-
112
-
113
-
114
-
115
-
116
-
117
-
118
-
119
-
120
-
121
-
122
-
123
-
124
-
125
-
126
-
127
-
128
-
129
-
130
-
131
-
132
-
133
-
134
-
135
-
136
-
137
-
138
-
139
-
140
-
141
-
142
-
143
-
144
-
145
-
146
-
147
-
148
 |
 |

Experian Annual Report 200826
An element of the Group’s derivatives
is ineligible for hedge accounting
under IFRS. Gains or losses on
these derivatives arising from market
movements are charged or credited
to the Group income statement. In
the year ended 31 March 2008 this
amounted to a charge of US$29m
(2007: US$35m).
Pensions
At 31 March 2008 the Group has a
retirement benefit surplus for the
Experian defined benefit funded
schemes on an IAS 19 basis of
US$182m (2007: US$141m) and
separately reported pension
obligations of US$50m (2007:US$56m)
in respect of other schemes. Note 27
to the financial statements shows the
assumptions used together with the
other disclosures required by IAS 19.
Accounting policies and
standards
The principal accounting policies
used by the Group are shown in note 2
to the financial statements.
Use of non-GAAP measures
Experian has identified certain
measures that it believes provide
additional useful information on the
performance of the Group. As the
measures are not defined under IFRS
they may not be directly comparable
with other companies’ adjusted
measures. The non-GAAP measures
are not intended to be a substitute
for, or superior to, any IFRS measures
of performance. Certain non-GAAP
measures identified by the Group
are shown in note 2 to the financial
statements. Further non-GAAP
measures and reconciliations of those
measures are set out below.
Discontinuing activities:
Experian defines discontinuing
activities as businesses sold, closed
or identified for closure during a
financial year. These are treated
as discontinuing activities for
both revenue and EBIT purposes.
Comparative information is
restated to exclude the results
of discontinuing activities. This
financial measure differs from the
definition of discontinued operations
set out in IFRS 5 ‘Non-current assets
held for sale and discontinued
operations’.
Under IFRS 5, a discontinued
operation is defined as: (i) a
separate major line of business or
geographical area of operations;
(ii) part of a single plan to dispose
of a major line of business or
geographical area of operations; or
(iii) a subsidiary acquired exclusively
with a view to resale.
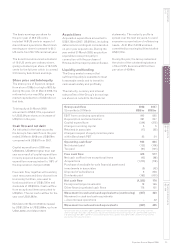
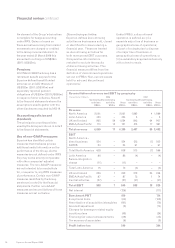
Reconciliation of revenue and EBIT by geography
12 months to 31 March 2008 2007
Continuing Discontinuing Continuing Discontinuing
activities activities Total activities activities Total
US$m US$m US$m US$m US$m US$m
Revenue
North America 2,061 – 2,061 1,985 4 1,989
Latin America 324 – 324 5 – 5
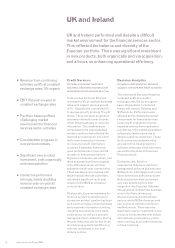
UK and Ireland 965 59 1,024 843 64 907
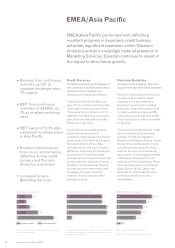
EMEA/Asia Pacific 710 12 721 574 17 591
Total revenue 4,059 71 4,130 3,407 85 3,492
EBIT
North America –
direct business 554 – 554 512 (7) 505
FARES 54 – 54 61 – 61
Total North America 608 – 608 573 (7) 566
Latin America 86 – 86 (4) – (4)
Serasa integration
charge (11) – (11) – – –
Total Latin America 75 – 75 (4) – (4)
UK and Ireland 226 7 232 212 24 236
EMEA/Asia Pacific 87 – 87 73 1 74
Central activities (57) – (57) (47) – (47)
Total EBIT 938 7 945 808 18 825
Net interest (126) (111)
Benchmark PBT 819 714
Exceptional items (63) (162)
Amortisation of acquisition intangibles (121) (76)
Goodwill adjustment (2) (14)
Charges for demerger-related equity
incentive plans (49) (24)
Financing fair value remeasurements (29) (35)
Tax expense of associates (6) (9)
Profit before tax 549 394
Financial review continued