Experian 2008 Annual Report Download - page 101
Download and view the complete annual report
Please find page 101 of the 2008 Experian annual report below. You can navigate through the pages in the report by either clicking on the pages listed below, or by using the keyword search tool below to find specific information within the annual report.-
 1
1 -
2
-
3
-
4
-
5
-
6
-
7
-
8
-
9
-
10
-
11
-
12
-
13
-
14
-
15
-
16
-
17
-
18
-
19
-
20
-
21
-
22
-
23
-
24
-
25
-
26
-
27
-
28
-
29
-
30
-
31
-
32
-
33
-
34
-
35
-
36
-
37
-
38
-
39
-
40
-
41
-
42
-
43
-
44
-
45
-
46
-
47
-
48
-
49
-
50
-
51
-
52
-
53
-
54
-
55
-
56
-
57
-
58
-
59
-
60
-
61
-
62
-
63
-
64
-
65
-
66
-
67
-
68
-
69
-
70
-
71
-
72
-
73
-
74
-
75
-
76
-
77
-
78
-
79
-
80
-
81
-
82
-
83
-
84
-
85
-
86
-
87
-
88
-
89
-
90
-
 91
91 -
 92
92 -
 93
93 -
 94
94 -
 95
95 -
 96
96 -
 97
97 -
 98
98 -
 99
99 -
 100
100 -
 101
101 -
 102
102 -
 103
103 -
 104
104 -
 105
105 -
 106
106 -
 107
107 -
 108
108 -
 109
109 -
 110
110 -
 111
111 -
112
-
113
-
114
-
115
-
116
-
117
-
118
-
119
-
120
-
121
-
122
-
123
-
124
-
125
-
126
-
127
-
128
-
129
-
130
-
131
-
132
-
133
-
134
-
135
-
136
-
137
-
138
-
139
-
140
-
141
-
142
-
143
-
144
-
145
-
146
-
147
-
148
 |
 |

99Experian Annual Report 2008
Introduction
2 – 5
Business review
6 – 37
Governance
38 – 64
Financial statements
Group financial statements
Financial statements
Group financial statements
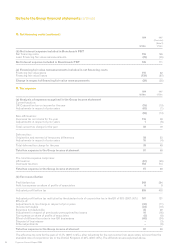
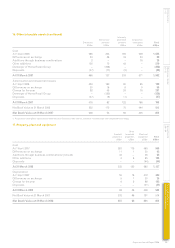
16. Other intangible assets (continued)
Internally
Internal use generated Acquisition
Databases software software intangibles1 To t a l
US$m US$m US$m US$m US$m
Cost
At 1 April 2006 585 355 165 529 1,634
Differences on exchange 24 26 16 24 90
Additions through business combinations 2 – – 18 20
Other additions 102 75 42 – 219
Demerger of Home Retail Group – (308) – – (308)
Disposals (47) (11) (5) – (63)
At 31 March 2007 666 137 218 571 1,592
Amortisation and impairment losses
At 1 April 2006 353 180 90 85 708
Differences on exchange 20 16 9 5 50
Charge for the year 92 45 24 76 237
Demerger of Home Retail Group – (150) – – (150)
Disposals (47) (9) (1) – (57)
At 31 March 2007 418 82 122 166 788
Net Book Value at 31 March 2006 232 175 75 444 926
Net Book Value at 31 March 2007 248 55 96 405 804
1. Acquisition intangibles represents trademarks and licences, trade names, customer relationships and completed technology.
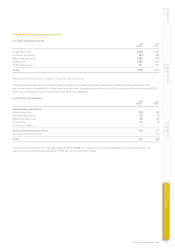
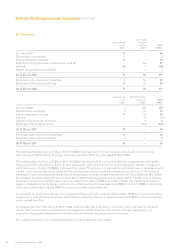
17. Property, plant and equipment
Short
Freehold leasehold Plant and
properties properties equipment To t a l
US$m US$m US$m US$m
Cost
At 1 April 2007 287 115 563 965
Differences on exchange 11 1 30 42
Additions through business combinations (note 34) 33 – 36 69
Other additions 4 6 95 105
Disposals – – (44) (44)
At 31 March 2008 335 122 680 1,137
Depreciation
At 1 April 2007 55 19 372 446
Differences on exchange 5 1 20 26
Charge for the year 8 6 88 102
Disposals – – (41) (41)
At 31 March 2008 68 26 439 533
Net Book Value at 31 March 2007 232 96 191 519
Net Book Value at 31 March 2008 267 96 241 604