Experian 2008 Annual Report Download - page 22
Download and view the complete annual report
Please find page 22 of the 2008 Experian annual report below. You can navigate through the pages in the report by either clicking on the pages listed below, or by using the keyword search tool below to find specific information within the annual report.-
 1
1 -
2
-
3
-
4
-
5
-
6
-
7
-
8
-
9
-
10
-
11
-
 12
12 -
 13
13 -
 14
14 -
 15
15 -
 16
16 -
 17
17 -
 18
18 -
 19
19 -
 20
20 -
 21
21 -
 22
22 -
 23
23 -
 24
24 -
 25
25 -
 26
26 -
 27
27 -
 28
28 -
 29
29 -
 30
30 -
 31
31 -
 32
32 -
33
-
34
-
35
-
36
-
37
-
38
-
39
-
40
-
41
-
42
-
43
-
44
-
45
-
46
-
47
-
48
-
49
-
50
-
51
-
52
-
53
-
54
-
55
-
56
-
57
-
58
-
59
-
60
-
61
-
62
-
63
-
64
-
65
-
66
-
67
-
68
-
69
-
70
-
71
-
72
-
73
-
74
-
75
-
76
-
77
-
78
-
79
-
80
-
81
-
82
-
83
-
84
-
85
-
86
-
87
-
88
-
89
-
90
-
91
-
92
-
93
-
94
-
95
-
96
-
97
-
98
-
99
-
100
-
101
-
102
-
103
-
104
-
105
-
106
-
107
-
108
-
109
-
110
-
111
-
112
-
113
-
114
-
115
-
116
-
117
-
118
-
119
-
120
-
121
-
122
-
123
-
124
-
125
-
126
-
127
-
128
-
129
-
130
-
131
-
132
-
133
-
134
-
135
-
136
-
137
-
138
-
139
-
140
-
141
-
142
-
143
-
144
-
145
-
146
-
147
-
148
 |
 |

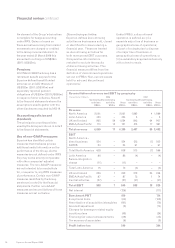
20 Experian Annual Report 2008
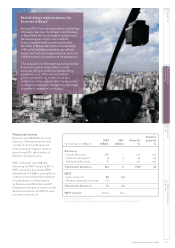
Organic growth Acquired growth EBIT
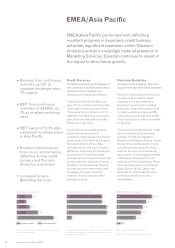
EMEA/Asia Pacific
EMEA/Asia Pacific performed well, reflecting
excellent progress in Experian’s credit bureaux
activities, significant expansion within Decision
Analytics and an increasingly material presence in
Marketing Services. Experian continues to invest in
the region to drive future growth.
Credit Services
Includes consumer credit bureaux in
ten countries, business information
bureaux in five countries and
transaction processing in France
Total revenue for Credit Services
grew 4% at constant exchange rates,
with organic revenue growth of 3%.
The acquisition contribution of 1%
reflected The pH Group. During the
year, Experian disposed of Loyalty
Solutions in Germany.
There were strong credit bureaux
performances across both
consumer and business information,
particularly in Southern and Eastern
Europe and South Africa. New
business wins in the year included
GE Money in Norway. At transaction
processing in France, business
process outsourcing performed well
and secured new business wins, as
did debit card processing. Cheque
processing performance was weak
as usage of cheques declines
in favour of debit card and other
payment options.
Decision Analytics
Includes credit analytics, decision
support software and fraud solutions
Decision Analytics performed very
strongly, with excellent organic
progress in the year, reflecting
Experian’s commitment to global
expansion. Total revenue growth at
constant exchange rates was 28%,
with organic revenue growth of 20%.
The acquisition contribution relates
to Tallyman.
There was strong demand for credit
decision products across many
markets, including in Western,
Southern and Eastern Europe, Japan,
Korea, China and Australia. There
was also good progress for fraud
solution services, such as Hunter,
particularly in the emerging markets
of Russia and Turkey which are
growing well off a small base. There
were new business wins in France,
Spain, South Africa, Japan and
Australia for both credit decision
and fraud prevention scores
and software.
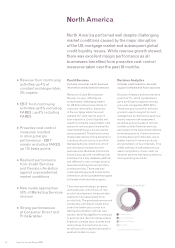
• Revenue from continuing
activities up 13% at
constant exchange rates;
7% organic
• EBIT from continuing
activities of US$87m, up
7% at constant exchange
rates
• EBIT margin of 12.3% after
investment in infrastructure
in Asia Pacific
• Excellent performances
from core credit activities,
reflecting strong credit
bureaux and Decision
Analytics momentum
• Increased scale in
Marketing Services
EBIT (US$m) and marginTotal revenue growth Organic revenue growth
7%08
07
06
05
04
7%
8%
8%
1%
Organic growth is defined as year-on-year revenue growth
at constant exchange rates, excluding acquisitions until the
date of their anniversary
11%
Organic growth Acquired growth
8%
18%
31%
13%
Total growth is defined as year-on-year revenue growth at
constant exchange rates
08
07
06
05
04
12.3%
12.7%
12.3%
12.2%
12.1%
EBIT excludes discontinuing activities
EBIT margin is for continuing activities only
08 87
07 73
06 64
05 59
04 47