Xerox 2013 Annual Report Download - page 98
Download and view the complete annual report
Please find page 98 of the 2013 Xerox annual report below. You can navigate through the pages in the report by either clicking on the pages listed below, or by using the keyword search tool below to find specific information within the annual report.-
 1
1 -
2
-
3
-
4
-
5
-
6
-
7
-
8
-
9
-
10
-
11
-
12
-
13
-
14
-
15
-
16
-
17
-
18
-
19
-
20
-
21
-
22
-
23
-
24
-
25
-
26
-
27
-
28
-
29
-
30
-
31
-
32
-
33
-
34
-
35
-
36
-
37
-
38
-
39
-
40
-
41
-
42
-
43
-
44
-
45
-
46
-
47
-
48
-
49
-
50
-
51
-
52
-
53
-
54
-
55
-
56
-
57
-
58
-
59
-
60
-
61
-
62
-
63
-
64
-
65
-
66
-
67
-
68
-
69
-
70
-
71
-
72
-
73
-
74
-
75
-
76
-
77
-
78
-
79
-
80
-
81
-
82
-
83
-
84
-
85
-
86
-
87
-
 88
88 -
 89
89 -
 90
90 -
 91
91 -
 92
92 -
 93
93 -
 94
94 -
 95
95 -
 96
96 -
 97
97 -
 98
98 -
 99
99 -
 100
100 -
 101
101 -
 102
102 -
 103
103 -
 104
104 -
 105
105 -
 106
106 -
 107
107 -
 108
108 -
109
-
110
-
111
-
112
-
113
-
114
-
115
-
116
-
117
-
118
-
119
-
120
-
121
-
122
-
123
-
124
-
125
-
126
-
127
-
128
-
129
-
130
-
131
-
132
-
133
-
134
-
135
-
136
-
137
-
138
-
139
-
140
-
141
-
142
-
143
-
144
-
145
-
146
-
147
-
148
-
149
-
150
-
151
-
152
 |
 |

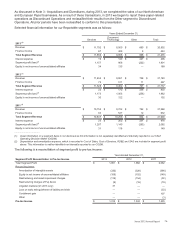
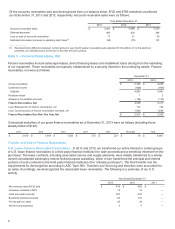
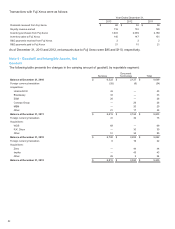
Of the accounts receivables sold and derecognized from our balance sheet, $723 and $766 remained uncollected
as of December 31, 2013 and 2012, respectively. Accounts receivable sales were as follows:
Year Ended December 31,
2013 2012 2011
Accounts receivable sales $3,401 $3,699 $3,218
Deferred proceeds 486 639 386
Loss on sale of accounts receivables 17 21 20
Estimated (decrease) increase to operating cash flows(1) (55)(78)133
_______________
(1) Represents the difference between current and prior year fourth quarter receivable sales adjusted for the effects of: (i) the deferred
proceeds, (ii) collections prior to the end of the year and (iii) currency.
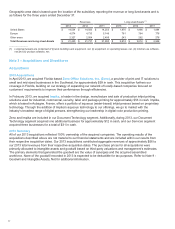
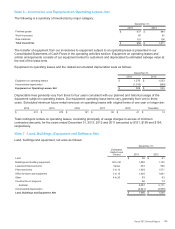
Note 5 – Finance Receivables, Net
Finance receivables include sales-type leases, direct financing leases and installment loans arising from the marketing
of our equipment. These receivables are typically collateralized by a security interest in the underlying assets. Finance
receivables, net were as follows:
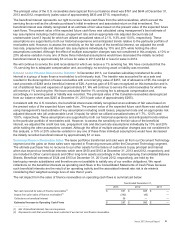
December 31,
2013 2012
Gross receivables $ 5,349 $ 6,290
Unearned income (666) (809)
Subtotal 4,683 5,481
Residual values 1 2
Allowance for doubtful accounts (154) (170)
Finance Receivables, Net 4,530 5,313
Less: Billed portion of finance receivables, net 113 152
Less: Current portion of finance receivables not billed, net 1,500 1,836
Finance Receivables Due After One Year, Net $2,917 $ 3,325
Contractual maturities of our gross finance receivables as of December 31, 2013 were as follows (including those
already billed of $124):
2014 2015 2016 2017 2018 Thereafter Total
$ 2,010 $ 1,504 $ 1,023 $572 $221 $ 19 $ 5,349
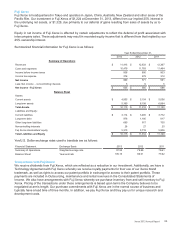
Transfer and Sale of Finance Receivables
U.S. Lease Finance Receivable Transactions - In 2013 and 2012, we transferred our entire interest in certain groups
of U.S. lease finance receivables to a third-party financial institution for cash proceeds and a beneficial interest from the
purchaser. The lease contracts, including associated service and supply elements, were initially transferred to a wholly-
owned consolidated bankruptcy-remote limited purpose subsidiary, which in turn transferred the principal and interest
portions of such contracts to the third-party financial institution (the “ultimate purchaser”). The final transfer met the
requirements for derecognition according to ASC Topic 860, Transfers and Servicing and therefore were accounted for
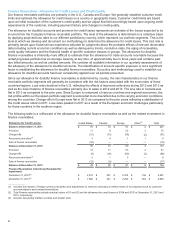
as sales. Accordingly, we derecognized the associated lease receivables. The following is a summary of our U.S.
activity:
Year Ended December 31,
2013 2012 2011
Net carrying value (NCV) sold $ 419 $682 $ —
Allowance included in NCV 12 18 —
Cash proceeds received 387 630 —
Beneficial interests received 60 101 —
Pre-tax gain on sales 25 44 —
Net fees and expenses 3 5—
81