Xerox 2013 Annual Report Download - page 57
Download and view the complete annual report
Please find page 57 of the 2013 Xerox annual report below. You can navigate through the pages in the report by either clicking on the pages listed below, or by using the keyword search tool below to find specific information within the annual report.-
 1
1 -
2
-
3
-
4
-
5
-
6
-
7
-
8
-
9
-
10
-
11
-
12
-
13
-
14
-
15
-
16
-
17
-
18
-
19
-
20
-
21
-
22
-
23
-
24
-
25
-
26
-
27
-
28
-
29
-
30
-
31
-
32
-
33
-
34
-
35
-
36
-
37
-
38
-
39
-
40
-
41
-
42
-
43
-
44
-
45
-
46
-
 47
47 -
 48
48 -
 49
49 -
 50
50 -
 51
51 -
 52
52 -
 53
53 -
 54
54 -
 55
55 -
 56
56 -
 57
57 -
 58
58 -
 59
59 -
 60
60 -
 61
61 -
 62
62 -
 63
63 -
 64
64 -
 65
65 -
 66
66 -
 67
67 -
68
-
69
-
70
-
71
-
72
-
73
-
74
-
75
-
76
-
77
-
78
-
79
-
80
-
81
-
82
-
83
-
84
-
85
-
86
-
87
-
88
-
89
-
90
-
91
-
92
-
93
-
94
-
95
-
96
-
97
-
98
-
99
-
100
-
101
-
102
-
103
-
104
-
105
-
106
-
107
-
108
-
109
-
110
-
111
-
112
-
113
-
114
-
115
-
116
-
117
-
118
-
119
-
120
-
121
-
122
-
123
-
124
-
125
-
126
-
127
-
128
-
129
-
130
-
131
-
132
-
133
-
134
-
135
-
136
-
137
-
138
-
139
-
140
-
141
-
142
-
143
-
144
-
145
-
146
-
147
-
148
-
149
-
150
-
151
-
152
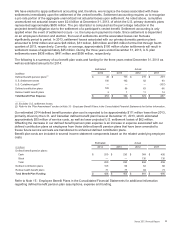
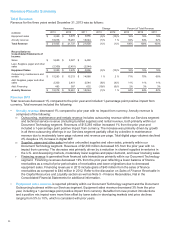
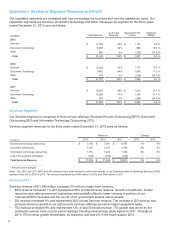
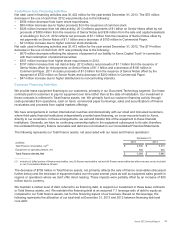
 |
 |
Note: With the exception of Deferred compensation investment gains, all items comprising Other Expense, Net are
reported in the Other segment. Deferred compensation investment gains are reported in the Services segment as
an offset to the associated compensation expense - see below.
Non-Financing Interest Expense: Non-financing interest expense for the year ended December 31, 2013 of $243
million was $11 million higher than prior year primarily due to a higher average cost of debt. When non-financing
interest expense is combined with financing interest expense (cost of financing), total company interest expense
declined by $24 million from the prior year, primarily driven by a lower total average debt balance partially offset by
a higher average cost of debt.
Refer to Note 12 - Debt in the Consolidated Financial Statements for additional information regarding our allocation
of interest expense.
Non-financing interest expense for the year ended December 31, 2012 of $232 million was $15 million lower than
the prior year. The decrease in interest expense is primarily due to the benefit of lower borrowing costs achieved as
a result of refinancing existing debt. When non-financing interest expense is combined with financing interest
expense (cost of financing), total company interest expense declined by $48 million from the prior year.
(Gains) Losses on Sales of Businesses and Assets: The 2013 gains on sales of businesses and assets include
the following transactions:
• A $29 million gain on the sale of a portion of our Wilsonville, Oregon product design, engineering and chemistry
group and related assets that were surplus to our needs for $32.5 million in cash to 3D Systems, Inc. (3D
Systems). The sale involved the transfer of approximately 100 engineers and contractors to 3D Systems. The
related assets include laboratory, testing and modeling equipment. The sale also included a grant of a non-
exclusive license to certain patents and non-patented intellectual property to enable 3D Systems to continue
development of certain technologies associated with the transferred employees and related assets.
• A $23 million gain on the sale of a surplus facility in the U.S.
• An $8 million gain on the sale of a surplus facility in Latin America.
Currency (Gains) Losses, Net: Currency (gains) losses primarily result from the re-measurement of foreign
currency-denominated assets and liabilities, the cost of hedging foreign currency-denominated assets and liabilities
and the mark-to-market of foreign exchange contracts utilized to hedge those foreign currency-denominated assets
and liabilities. The 2011 net currency losses were primarily due to the significant movement in exchange rates
during the third quarter of 2011 among the U.S. Dollar, Euro, Yen and several developing market currencies.
Litigation Matters: Litigation matters for 2013 of $(34) million primarily reflects the benefit resulting from a reserve
reduction related to litigation developments.
Litigation matters for 2012 and 2011 primarily represent charges related to probable losses for various legal matters,
none of which were individually material. Refer to Note 17 - Contingencies and Litigation, in the Consolidated
Financial Statements for additional information regarding litigation against the Company.
Loss on Sales of Accounts Receivables: Represents the loss incurred on our sales of accounts receivables.
Refer to "Sales of Accounts Receivables" below and Note 4 - Accounts Receivables, Net in the Consolidated
Financial Statements for additional information regarding our sales of receivables.
Loss on Early Extinguishment of Liability: The 2011 loss of $33 million was related to the redemption by Xerox
Capital Trust I, our wholly-owned subsidiary trust, of its $650 million 8% Preferred Securities due in 2027. The
redemption resulted in a pre-tax loss of $33 million ($20 million after-tax), representing the call premium of
approximately $10 million, as well as the write-off of unamortized debt costs and other liability carrying value
adjustments of $23 million.
Deferred Compensation Investment Gains: Represents gains on investments supporting certain of our deferred
compensation arrangements. These gains or losses are offset by an increase or decrease, respectively, in
compensation expense recorded in SAG in our Services segment as a result of the increase or decrease in the
liability associated with these arrangements.
Income Taxes
The 2013 effective tax rate was 21.0% or 24.5% on an adjusted basis1. The adjusted tax rate for 2013 was lower
than the U.S. statutory tax rate primarily due to foreign tax credits resulting from actual and anticipated dividends
Xerox 2013 Annual Report 40