Xerox 2013 Annual Report Download - page 60
Download and view the complete annual report
Please find page 60 of the 2013 Xerox annual report below. You can navigate through the pages in the report by either clicking on the pages listed below, or by using the keyword search tool below to find specific information within the annual report.-
 1
1 -
2
-
3
-
4
-
5
-
6
-
7
-
8
-
9
-
10
-
11
-
12
-
13
-
14
-
15
-
16
-
17
-
18
-
19
-
20
-
21
-
22
-
23
-
24
-
25
-
26
-
27
-
28
-
29
-
30
-
31
-
32
-
33
-
34
-
35
-
36
-
37
-
38
-
39
-
40
-
41
-
42
-
43
-
44
-
45
-
46
-
47
-
48
-
49
-
 50
50 -
 51
51 -
 52
52 -
 53
53 -
 54
54 -
 55
55 -
 56
56 -
 57
57 -
 58
58 -
 59
59 -
 60
60 -
 61
61 -
 62
62 -
 63
63 -
 64
64 -
 65
65 -
 66
66 -
 67
67 -
 68
68 -
 69
69 -
 70
70 -
71
-
72
-
73
-
74
-
75
-
76
-
77
-
78
-
79
-
80
-
81
-
82
-
83
-
84
-
85
-
86
-
87
-
88
-
89
-
90
-
91
-
92
-
93
-
94
-
95
-
96
-
97
-
98
-
99
-
100
-
101
-
102
-
103
-
104
-
105
-
106
-
107
-
108
-
109
-
110
-
111
-
112
-
113
-
114
-
115
-
116
-
117
-
118
-
119
-
120
-
121
-
122
-
123
-
124
-
125
-
126
-
127
-
128
-
129
-
130
-
131
-
132
-
133
-
134
-
135
-
136
-
137
-
138
-
139
-
140
-
141
-
142
-
143
-
144
-
145
-
146
-
147
-
148
-
149
-
150
-
151
-
152
 |
 |

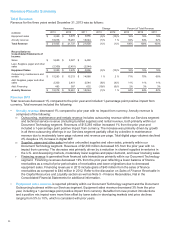
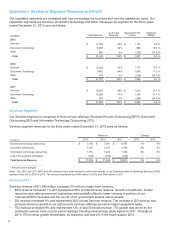
Operations Review of Segment Revenue and Profit
Our reportable segments are consistent with how we manage the business and view the markets we serve. Our
reportable segments are Services, Document Technology and Other. Revenues by segment for the three years
ended December 31, 2013 were as follows:
(in millions) Total Revenue
% of Total
Revenue
Segment Profit
(Loss)
Segment
Margin
2013
Services $11,859 55% $ 1,157 9.8 %
Document Technology 8,908 42% 966 10.8 %
Other 668 3% (222) (33.2)%
Total $21,435 100% $ 1,901 8.9 %
2012
Services $11,528 53% 1,173 10.2 %
Document Technology 9,462 44% 1,065 11.3 %
Other 747 3% (256) (34.3)%
Total $21,737 100% $ 1,982 9.1 %
2011
Services $10,837 49% $ 1,207 11.1 %
Document Technology 10,259 47% 1,140 11.1 %
Other 804 4% (285) (35.4)%
Total $21,900 100% $ 2,062 9.4 %
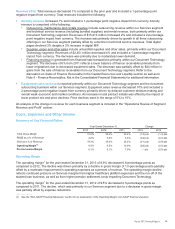
Services Segment
Our Services segment is comprised of three service offerings: Business Process Outsourcing (BPO), Document
Outsourcing (DO) and Information Technology Outsourcing (ITO).
Services segment revenues for the three years ended December 31, 2013 were as follows:
Revenue Change
(in millions) 2013 2012 2011 2013 2012
Business processing outsourcing $ 7,160 $7,061 $6,470 1% 9%
Document outsourcing 3,337 3,210 3,149 4% 2%
Information technology outsourcing 1,551 1,426 1,326 9% 8%
Less: Intra-segment elimination (189)(169)(108) * *
Total Services Revenue $11,859 $11,528 $10,837 3% 6%
____________________________
* Percent not meaningful.
Note: The 2012 and 2011 BPO and DO revenues have been revised to reflect the transfer of our Communication & Marketing Services (CMS)
business from DO to BPO in 2013. The revenue transfered was $450 million in 2012 and $396 million in 2011.
Revenue 2013
Services revenue of $11,859 million increased 3% with no impact from currency.
• BPO revenue increased 1% and represented 59% of total Services revenue. Growth in healthcare, human
resources and state government businesses were partially offset by lower volumes in portions of our
commercial BPO business and the run-off of our government student loan business.
• DO revenue increased 4% and represented 28% of total Services revenue. The increase in DO revenue was
primarily driven by growth in our partner print services offerings as well as higher equipment sales.
• ITO revenue increased 9% and represented 13% of total Services revenue. ITO growth was driven by the
continued revenue ramp on prior period signings including several large deals signed in 2011. Throughout
2013, ITO revenue growth decelerated, as expected, and was 2% in the fourth quarter 2013.
43