Xerox 2013 Annual Report Download - page 79
Download and view the complete annual report
Please find page 79 of the 2013 Xerox annual report below. You can navigate through the pages in the report by either clicking on the pages listed below, or by using the keyword search tool below to find specific information within the annual report.-
 1
1 -
2
-
3
-
4
-
5
-
6
-
7
-
8
-
9
-
10
-
11
-
12
-
13
-
14
-
15
-
16
-
17
-
18
-
19
-
20
-
21
-
22
-
23
-
24
-
25
-
26
-
27
-
28
-
29
-
30
-
31
-
32
-
33
-
34
-
35
-
36
-
37
-
38
-
39
-
40
-
41
-
42
-
43
-
44
-
45
-
46
-
47
-
48
-
49
-
50
-
51
-
52
-
53
-
54
-
55
-
56
-
57
-
58
-
59
-
60
-
61
-
62
-
63
-
64
-
65
-
66
-
67
-
68
-
 69
69 -
 70
70 -
 71
71 -
 72
72 -
 73
73 -
 74
74 -
 75
75 -
 76
76 -
 77
77 -
 78
78 -
 79
79 -
 80
80 -
 81
81 -
 82
82 -
 83
83 -
 84
84 -
 85
85 -
 86
86 -
 87
87 -
 88
88 -
 89
89 -
90
-
91
-
92
-
93
-
94
-
95
-
96
-
97
-
98
-
99
-
100
-
101
-
102
-
103
-
104
-
105
-
106
-
107
-
108
-
109
-
110
-
111
-
112
-
113
-
114
-
115
-
116
-
117
-
118
-
119
-
120
-
121
-
122
-
123
-
124
-
125
-
126
-
127
-
128
-
129
-
130
-
131
-
132
-
133
-
134
-
135
-
136
-
137
-
138
-
139
-
140
-
141
-
142
-
143
-
144
-
145
-
146
-
147
-
148
-
149
-
150
-
151
-
152
 |
 |
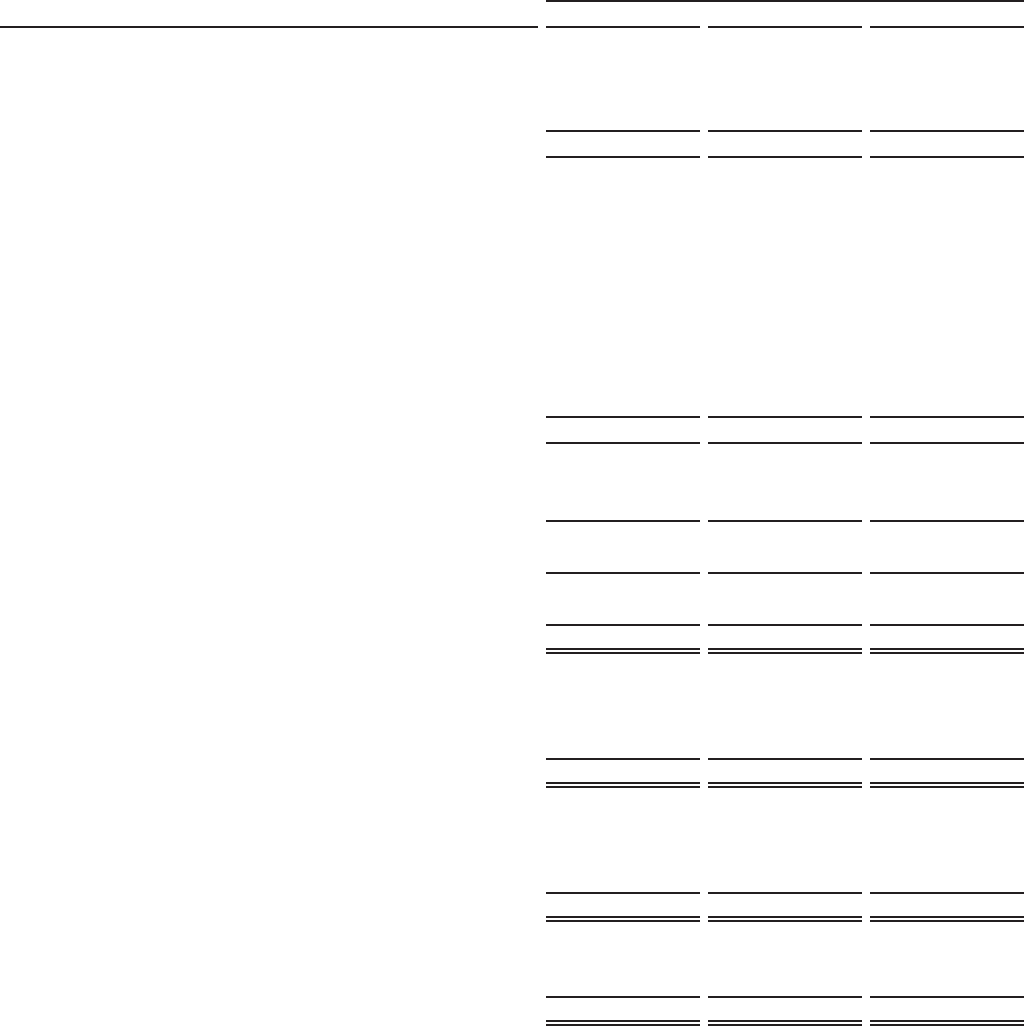
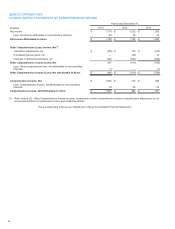
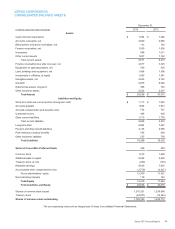
XEROX CORPORATION
CONSOLIDATED STATEMENTS OF INCOME
Year Ended December 31,
(in millions, except per-share data) 2013 2012 2011
Revenues
Sales $ 5,659 $5,927 $6,400
Outsourcing, maintenance and rentals 15,293 15,213 14,868
Financing 483 597 632
Total Revenues 21,435 21,737 21,900
Costs and Expenses
Cost of sales 3,616 3,791 4,076
Cost of outsourcing, maintenance and rentals 11,008 10,802 10,269
Cost of financing 163 198 231
Research, development and engineering expenses 601 655 719
Selling, administrative and general expenses 4,137 4,216 4,421
Restructuring and asset impairment charges 116 154 32
Amortization of intangible assets 332 328 398
Curtailment gain — — (107)
Other expenses, net 150 261 326
Total Costs and Expenses 20,123 20,405 20,365
Income Before Income Taxes and Equity Income 1,312 1,332 1,535
Income tax expense 276 272 377
Equity in net income of unconsolidated affiliates 169 152 149
Income from Continuing Operations 1,205 1,212 1,307
(Loss) income from discontinued operations, net of tax (26) 11 21
Net Income 1,179 1,223 1,328
Less: Net income attributable to noncontrolling interests 20 28 33
Net Income Attributable to Xerox $1,159 $1,195 $1,295
Amounts attributable to Xerox:
Net income from continuing operations $ 1,185 $1,184 $1,274
Net (loss) income from discontinued operations (26) 11 21
Net Income Attributable to Xerox $1,159 $1,195 $1,295
Basic Earnings per Share:
Continuing operations $ 0.95 $0.89 $0.90
Discontinued operations (0.02)0.01 0.02
Total Basic Earnings per Share $0.93 $0.90 $0.92
Diluted Earnings per Share:
Continuing operations $ 0.93 $0.87 $0.88
Discontinued operations (0.02)0.01 0.02
Total Diluted Earnings per Share $0.91 $0.88 $0.90
The accompanying notes are an integral part of these Consolidated Financial Statements.
Xerox 2013 Annual Report 62