Xerox 2013 Annual Report Download - page 43
Download and view the complete annual report
Please find page 43 of the 2013 Xerox annual report below. You can navigate through the pages in the report by either clicking on the pages listed below, or by using the keyword search tool below to find specific information within the annual report.-
 1
1 -
2
-
3
-
4
-
5
-
6
-
7
-
8
-
9
-
10
-
11
-
12
-
13
-
14
-
15
-
16
-
17
-
18
-
19
-
20
-
21
-
22
-
23
-
24
-
25
-
26
-
27
-
28
-
29
-
30
-
31
-
32
-
 33
33 -
 34
34 -
 35
35 -
 36
36 -
 37
37 -
 38
38 -
 39
39 -
 40
40 -
 41
41 -
 42
42 -
 43
43 -
 44
44 -
 45
45 -
 46
46 -
 47
47 -
 48
48 -
 49
49 -
 50
50 -
 51
51 -
 52
52 -
 53
53 -
54
-
55
-
56
-
57
-
58
-
59
-
60
-
61
-
62
-
63
-
64
-
65
-
66
-
67
-
68
-
69
-
70
-
71
-
72
-
73
-
74
-
75
-
76
-
77
-
78
-
79
-
80
-
81
-
82
-
83
-
84
-
85
-
86
-
87
-
88
-
89
-
90
-
91
-
92
-
93
-
94
-
95
-
96
-
97
-
98
-
99
-
100
-
101
-
102
-
103
-
104
-
105
-
106
-
107
-
108
-
109
-
110
-
111
-
112
-
113
-
114
-
115
-
116
-
117
-
118
-
119
-
120
-
121
-
122
-
123
-
124
-
125
-
126
-
127
-
128
-
129
-
130
-
131
-
132
-
133
-
134
-
135
-
136
-
137
-
138
-
139
-
140
-
141
-
142
-
143
-
144
-
145
-
146
-
147
-
148
-
149
-
150
-
151
-
152
 |
 |
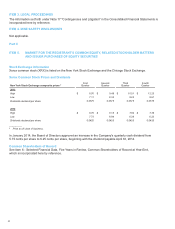
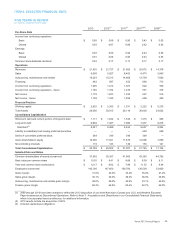
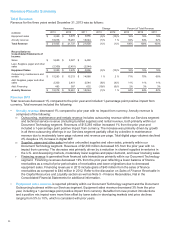
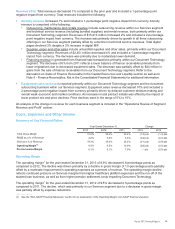
ITEM 6. SELECTED FINANCIAL DATA
FIVE YEARS IN REVIEW
(in millions, except per-share data)
2013 2012(1) 2011(1) 2010(1)(2) 2009(1)
Per-Share Data
Income from continuing operations
Basic $ 0.95 $0.89 $0.90 $0.43 $0.55
Diluted 0.93 0.87 0.88 0.42 0.54
Earnings
Basic 0.93 0.90 0.92 0.44 0.56
Diluted 0.91 0.88 0.90 0.43 0.55
Common stock dividends declared 0.23 0.17 0.17 0.17 0.17
Operations
Revenues $ 21,435 $ 21,737 $ 21,900 $ 20,872 $14,376
Sales 5,659 5,927 6,400 6,473 5,843
Outsourcing, maintenance and rentals 15,293 15,213 14,868 13,739 7,820
Financing 483 597 632 660 713
Income from continuing operations 1,205 1,212 1,307 622 509
Income from continuing operations - Xerox 1,185 1,184 1,274 591 478
Net income 1,179 1,223 1,328 637 516
Net income - Xerox 1,159 1,195 1,295 606 485
Financial Position
Working capital $ 2,825 $2,363 $1,531 $2,222 $5,270
Total Assets 29,036 30,015 30,116 30,600 24,032
Consolidated Capitalization
Short-term debt and current portion of long-term debt $ 1,117 $1,042 $1,545 $1,370 $988
Long-term debt 6,904 7,447 7,088 7,237 8,276
Total Debt(3) 8,021 8,489 8,633 8,607 9,264
Liability to subsidiary trust issuing preferred securities — — — 650 649
Series A convertible preferred stock 349 349 349 349 —
Xerox shareholders' equity 12,300 11,521 11,876 12,006 7,050
Noncontrolling interests 119 143 149 153 141
Total Consolidated Capitalization $20,789 $ 20,502 $ 21,007 $ 21,765 $17,104
Selected Data and Ratios
Common shareholders of record at year-end 37,552 39,397 41,982 43,383 44,792
Book value per common share $ 10.35 $9.41 $8.88 $8.59 $8.11
Year-end common stock market price $ 12.17 $6.82 $7.96 $11.52 $8.46
Employees at year-end 143,100 147,600 139,700 136,500 53,600
Gross margin 31.0%32.0%33.4%35.2%41.2%
Sales gross margin 36.1%36.0%36.3%36.9%36.8%
Outsourcing, maintenance and rentals gross margin 28.0%29.0%30.9%33.1%42.6%
Finance gross margin 66.3%66.8%63.4%62.7%62.0%
___________
(1) 2009 through 2012 have been restated to reflect the 2013 disposition of our North American (Canada and U.S.) and Western European
Paper businesses as Discontinued Operations. Refer to Note 3 - Acquisitions and Divestitures in our Consolidated Financial Statements,
which is incorporated here by reference, for additional information.
(2) 2010 results include the acquisition of ACS.
(3) Includes capital lease obligations.
Xerox 2013 Annual Report 26