Xerox 2013 Annual Report Download - page 101
Download and view the complete annual report
Please find page 101 of the 2013 Xerox annual report below. You can navigate through the pages in the report by either clicking on the pages listed below, or by using the keyword search tool below to find specific information within the annual report.-
 1
1 -
2
-
3
-
4
-
5
-
6
-
7
-
8
-
9
-
10
-
11
-
12
-
13
-
14
-
15
-
16
-
17
-
18
-
19
-
20
-
21
-
22
-
23
-
24
-
25
-
26
-
27
-
28
-
29
-
30
-
31
-
32
-
33
-
34
-
35
-
36
-
37
-
38
-
39
-
40
-
41
-
42
-
43
-
44
-
45
-
46
-
47
-
48
-
49
-
50
-
51
-
52
-
53
-
54
-
55
-
56
-
57
-
58
-
59
-
60
-
61
-
62
-
63
-
64
-
65
-
66
-
67
-
68
-
69
-
70
-
71
-
72
-
73
-
74
-
75
-
76
-
77
-
78
-
79
-
80
-
81
-
82
-
83
-
84
-
85
-
86
-
87
-
88
-
89
-
90
-
 91
91 -
 92
92 -
 93
93 -
 94
94 -
 95
95 -
 96
96 -
 97
97 -
 98
98 -
 99
99 -
 100
100 -
 101
101 -
 102
102 -
 103
103 -
 104
104 -
 105
105 -
 106
106 -
 107
107 -
 108
108 -
 109
109 -
 110
110 -
 111
111 -
112
-
113
-
114
-
115
-
116
-
117
-
118
-
119
-
120
-
121
-
122
-
123
-
124
-
125
-
126
-
127
-
128
-
129
-
130
-
131
-
132
-
133
-
134
-
135
-
136
-
137
-
138
-
139
-
140
-
141
-
142
-
143
-
144
-
145
-
146
-
147
-
148
-
149
-
150
-
151
-
152
 |
 |

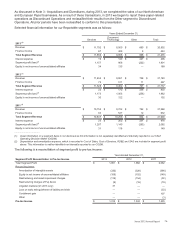
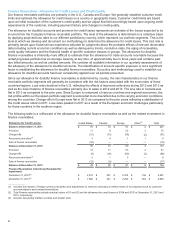
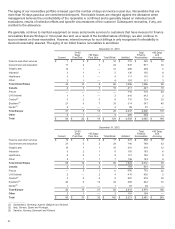
In the U.S. and Canada, customers are further evaluated or segregated by class based on industry sector. The primary
customer classes are Finance & Other Services, Government & Education; Graphic Arts; Industrial; Healthcare and
Other. In Europe, customers are further grouped by class based on the country or region of the customer. The primary
customer classes include the U.K./Ireland, France and the following European regions - Central, Nordic and Southern.
These groupings or classes are used to understand the nature and extent of our exposure to credit risk arising from
finance receivables.
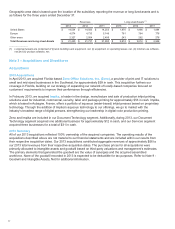
We evaluate our customers based on the following credit quality indicators:
• Investment grade: This rating includes accounts with excellent to good business credit, asset quality and the
capacity to meet financial obligations. These customers are less susceptible to adverse effects due to shifts in
economic conditions or changes in circumstance. The rating generally equates to a Standard & Poors (S&P) rating
of BBB- or better. Loss rates in this category are normally minimal at less than 1%.
• Non-investment grade: This rating includes accounts with average credit risk that are more susceptible to loss in
the event of adverse business or economic conditions. This rating generally equates to a BB S&P rating. Although
we experience higher loss rates associated with this customer class, we believe the risk is somewhat mitigated by
the fact that our leases are fairly well dispersed across a large and diverse customer base. In addition, the higher
loss rates are largely offset by the higher rates of return we obtain with such leases. Loss rates in this category are
generally in the range of 2% to 4%.
• Substandard: This rating includes accounts that have marginal credit risk such that the customer’s ability to make
repayment is impaired or may likely become impaired. We use numerous strategies to mitigate risk including higher
rates of interest, prepayments, personal guarantees, etc. Accounts in this category include customers who were
downgraded during the term of the lease from investment and non-investment grade evaluation when the lease was
originated. Accordingly there is a distinct possibility for a loss of principal and interest or customer default. The loss
rates in this category are around 10%.
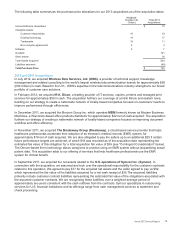
Credit quality indicators are updated at least annually, and the credit quality of any given customer can change during
the life of the portfolio. Details about our finance receivables portfolio based on industry and credit quality indicators are
as follows:
December 31, 2013 December 31, 2012
Investment
Grade
Non-
investment
Grade
Sub-
standard
Total
Finance
Receivables
Investment
Grade
Non-
investment
Grade
Sub-
standard
Total
Finance
Receivables
Finance and other services $ 189 $ 102 $ 34 $325 $252 $147 $ 59 $ 458
Government and education 656 12 3 671 750 15 4 769
Graphic arts 142 59 108 309 92 90 137 319
Industrial 92 28 15 135 115 31 17 163
Healthcare 74 25 16 115 109 37 14 160
Other 55 27 29 111 70 39 34 143
Total United States 1,208 253 205 1,666 1,388 359 265 2,012
Finance and other services 57 32 19 108 151 116 40 307
Government and education 96 9 1 106 117 10 2 129
Graphic arts 34 28 23 85 37 34 30 101
Industrial 34 22 23 79 66 40 29 135
Other 29 9 543 75 43 11 129
Total Canada 250 100 71 421 446 243 112 801
France 282 314 122 718 274 294 134 702
U.K./Ireland 199 171 42 412 215 155 50 420
Central(1) 287 394 43 724 315 445 56 816
Southern(2) 102 187 58 347 139 230 73 442
Nordic(3) 46 42 391 49 36 994
Total Europe 916 1,108 268 2,292 992 1,160 322 2,474
Other 226 69 9 304 148 39 7 194
Total $ 2,600 $ 1,530 $553 $4,683 $2,974 $1,801 $706 $ 5,481
_____________
(1) Switzerland, Germany, Austria, Belgium and Holland.
(2) Italy, Greece, Spain and Portugal.
(3) Sweden, Norway, Denmark and Finland.
Xerox 2013 Annual Report 84