Xerox 2013 Annual Report Download - page 113
Download and view the complete annual report
Please find page 113 of the 2013 Xerox annual report below. You can navigate through the pages in the report by either clicking on the pages listed below, or by using the keyword search tool below to find specific information within the annual report.-
 1
1 -
2
-
3
-
4
-
5
-
6
-
7
-
8
-
9
-
10
-
11
-
12
-
13
-
14
-
15
-
16
-
17
-
18
-
19
-
20
-
21
-
22
-
23
-
24
-
25
-
26
-
27
-
28
-
29
-
30
-
31
-
32
-
33
-
34
-
35
-
36
-
37
-
38
-
39
-
40
-
41
-
42
-
43
-
44
-
45
-
46
-
47
-
48
-
49
-
50
-
51
-
52
-
53
-
54
-
55
-
56
-
57
-
58
-
59
-
60
-
61
-
62
-
63
-
64
-
65
-
66
-
67
-
68
-
69
-
70
-
71
-
72
-
73
-
74
-
75
-
76
-
77
-
78
-
79
-
80
-
81
-
82
-
83
-
84
-
85
-
86
-
87
-
88
-
89
-
90
-
91
-
92
-
93
-
94
-
95
-
96
-
97
-
98
-
99
-
100
-
101
-
102
-
 103
103 -
 104
104 -
 105
105 -
 106
106 -
 107
107 -
 108
108 -
 109
109 -
 110
110 -
 111
111 -
 112
112 -
 113
113 -
 114
114 -
 115
115 -
 116
116 -
 117
117 -
 118
118 -
 119
119 -
 120
120 -
 121
121 -
 122
122 -
 123
123 -
124
-
125
-
126
-
127
-
128
-
129
-
130
-
131
-
132
-
133
-
134
-
135
-
136
-
137
-
138
-
139
-
140
-
141
-
142
-
143
-
144
-
145
-
146
-
147
-
148
-
149
-
150
-
151
-
152
 |
 |

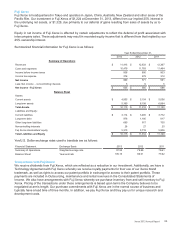
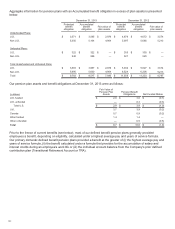
Interest expense and interest income was as follows:
Year Ended December 31,
2013 2012 2011
Interest expense(1) $406 $430 $478
Interest income(2) 494 610 653
_____________
(1) Includes Equipment financing interest expense, as well as non-financing interest expense included in Other expenses, net in the
Consolidated Statements of Income.
(2) Includes Finance income, as well as other interest income that is included in Other expenses, net in the Consolidated Statements of
Income.
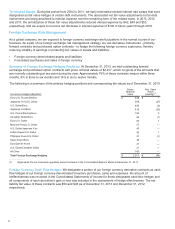
Equipment financing interest is determined based on an estimated cost of funds, applied against the estimated level
of debt required to support our net finance receivables. The estimated cost of funds is based on our overall
corporate cost of borrowing adjusted to reflect a rate that would be paid by a typical BBB rated leasing company.
The estimated level of debt is based on an assumed 7 to 1 leverage ratio of debt/equity as compared to our
average finance receivable balance during the applicable period.
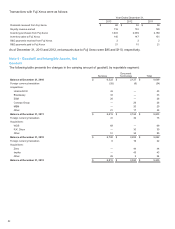
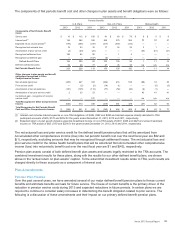
Net (Payments) Proceeds on Debt
Net proceeds (payments) on debt as shown on the Consolidated Statements of Cash Flows was as follows:
Year Ended December 31,
2013 2012 2011
Net proceeds (payments) on short-term debt $ 5$(108) $ (200)
Proceeds from issuance of long-term debt 617 1,116 1,000
Payments on long-term debt (1,056) (1,116) (751)
Net (Payments) Proceeds on Debt $(434) $ (108) $ 49
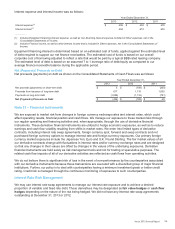
Note 13 – Financial Instruments
We are exposed to market risk from changes in foreign currency exchange rates and interest rates, which could
affect operating results, financial position and cash flows. We manage our exposure to these market risks through
our regular operating and financing activities and, when appropriate, through the use of derivative financial
instruments. These derivative financial instruments are utilized to hedge economic exposures, as well as to reduce
earnings and cash flow volatility resulting from shifts in market rates. We enter into limited types of derivative
contracts, including interest rate swap agreements, foreign currency spot, forward and swap contracts and net
purchased foreign currency options to manage interest rate and foreign currency exposures. Our primary foreign
currency market exposures include the Japanese Yen, Euro and U.K. Pound Sterling. The fair market values of all
our derivative contracts change with fluctuations in interest rates and/or currency exchange rates and are designed
so that any changes in their values are offset by changes in the values of the underlying exposures. Derivative
financial instruments are held solely as risk management tools and not for trading or speculative purposes. The
related cash flow impacts of all of our derivative activities are reflected as cash flows from operating activities.
We do not believe there is significant risk of loss in the event of non-performance by the counterparties associated
with our derivative instruments because these transactions are executed with a diversified group of major financial
institutions. Further, our policy is to deal with counterparties having a minimum investment grade or better credit
rating. Credit risk is managed through the continuous monitoring of exposures to such counterparties.
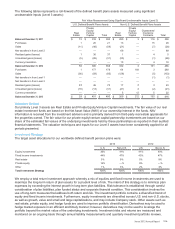
Interest Rate Risk Management
We may use interest rate swap agreements to manage our interest rate exposure and to achieve a desired
proportion of variable and fixed rate debt. These derivatives may be designated as fair value hedges or cash flow
hedges depending on the nature of the risk being hedged. We did not have any interest rate swap agreements
outstanding at December 31, 2013 or 2012.
Xerox 2013 Annual Report 96