Xerox 2013 Annual Report Download - page 121
Download and view the complete annual report
Please find page 121 of the 2013 Xerox annual report below. You can navigate through the pages in the report by either clicking on the pages listed below, or by using the keyword search tool below to find specific information within the annual report.-
 1
1 -
2
-
3
-
4
-
5
-
6
-
7
-
8
-
9
-
10
-
11
-
12
-
13
-
14
-
15
-
16
-
17
-
18
-
19
-
20
-
21
-
22
-
23
-
24
-
25
-
26
-
27
-
28
-
29
-
30
-
31
-
32
-
33
-
34
-
35
-
36
-
37
-
38
-
39
-
40
-
41
-
42
-
43
-
44
-
45
-
46
-
47
-
48
-
49
-
50
-
51
-
52
-
53
-
54
-
55
-
56
-
57
-
58
-
59
-
60
-
61
-
62
-
63
-
64
-
65
-
66
-
67
-
68
-
69
-
70
-
71
-
72
-
73
-
74
-
75
-
76
-
77
-
78
-
79
-
80
-
81
-
82
-
83
-
84
-
85
-
86
-
87
-
88
-
89
-
90
-
91
-
92
-
93
-
94
-
95
-
96
-
97
-
98
-
99
-
100
-
101
-
102
-
103
-
104
-
105
-
106
-
107
-
108
-
109
-
110
-
 111
111 -
 112
112 -
 113
113 -
 114
114 -
 115
115 -
 116
116 -
 117
117 -
 118
118 -
 119
119 -
 120
120 -
 121
121 -
 122
122 -
 123
123 -
 124
124 -
 125
125 -
 126
126 -
 127
127 -
 128
128 -
 129
129 -
 130
130 -
 131
131 -
132
-
133
-
134
-
135
-
136
-
137
-
138
-
139
-
140
-
141
-
142
-
143
-
144
-
145
-
146
-
147
-
148
-
149
-
150
-
151
-
152
 |
 |
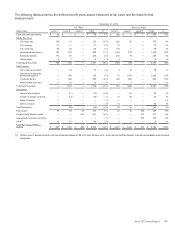
The following tables presents the defined benefit plans assets measured at fair value and the basis for that
measurement:
December 31, 2013
U.S. Plans Non-U.S. Plans
Asset Class Level 1 Level 2 Level 3 Total % Level 1 Level 2 Level 3 Total %
Cash and cash equivalents $ 48 $ — $ — $ 48 1 % $ 688 $ — $ — $ 688 12%
Equity Securities:
U.S. large cap 319 13 — 332 12 % 220 55 — 275 5%
U.S. mid cap 71 — — 71 2 % 13 — — 13 —%
U.S. small cap 48 46 — 94 3 % 40 — — 40 1%
International developed 182 123 — 305 11 % 1,314 212 — 1,526 26%
Emerging markets 171 69 — 240 8 % 262 76 — 338 6%
Global equity 2 7 — 9 — % 5 — — 5 —%
Total Equity Securities 793 258 — 1,051 36 % 1,854 343 — 2,197 38%
Fixed Income:
U.S. treasury securities — 74 — 74 3 % 4 16 — 20 —%
Debt security issued by
government agency — 180 — 180 6 % 31 1,189 — 1,220 21%
Corporate Bonds — 908 — 908 32 % 146 660 — 806 14%
Asset backed securities — 10 — 10 — % — 1 — 1 —%
Total Debt Securities — 1,172 — 1,172 41 % 181 1,866 — 2,047 35%
Derivatives:
Interest rate contracts — (17) — (17) (1)% — 62 — 62 1%
Foreign exchange contracts — (12) — (12) — % 14 30 — 44 1%
Equity contracts — — — — — % — — — — —%
Other Contracts — — — — — % 62 — — 62 1%
Total Derivatives — (29) — (29) (1)% 76 92 — 168 3%
Real estate 40 34 29 103 4 % 32 35 269 336 6%
Private equity/Venture capital — — 451 451 16 % — — 212 212 4%
Guaranteed insurance contracts — — — — — % — — 135 135 2%
Other(1) 10 70 — 80 3 % 6 — — 6 —%
Total Fair Value Of Plans
Assets $ 891 $ 1,505 $ 480 $ 2,876 100 % $ 2,837 $ 2,336 $ 616 $ 5,789 100%
_____________________________
(1) Other Level 1 assets include net non-financial assets of $9 U.S. and $6 Non-U.S., such as due to/from broker, interest receivables and accrued
expenses.
Xerox 2013 Annual Report
104