Xerox 2013 Annual Report Download - page 93
Download and view the complete annual report
Please find page 93 of the 2013 Xerox annual report below. You can navigate through the pages in the report by either clicking on the pages listed below, or by using the keyword search tool below to find specific information within the annual report.-
 1
1 -
2
-
3
-
4
-
5
-
6
-
7
-
8
-
9
-
10
-
11
-
12
-
13
-
14
-
15
-
16
-
17
-
18
-
19
-
20
-
21
-
22
-
23
-
24
-
25
-
26
-
27
-
28
-
29
-
30
-
31
-
32
-
33
-
34
-
35
-
36
-
37
-
38
-
39
-
40
-
41
-
42
-
43
-
44
-
45
-
46
-
47
-
48
-
49
-
50
-
51
-
52
-
53
-
54
-
55
-
56
-
57
-
58
-
59
-
60
-
61
-
62
-
63
-
64
-
65
-
66
-
67
-
68
-
69
-
70
-
71
-
72
-
73
-
74
-
75
-
76
-
77
-
78
-
79
-
80
-
81
-
82
-
 83
83 -
 84
84 -
 85
85 -
 86
86 -
 87
87 -
 88
88 -
 89
89 -
 90
90 -
 91
91 -
 92
92 -
 93
93 -
 94
94 -
 95
95 -
 96
96 -
 97
97 -
 98
98 -
 99
99 -
 100
100 -
 101
101 -
 102
102 -
 103
103 -
104
-
105
-
106
-
107
-
108
-
109
-
110
-
111
-
112
-
113
-
114
-
115
-
116
-
117
-
118
-
119
-
120
-
121
-
122
-
123
-
124
-
125
-
126
-
127
-
128
-
129
-
130
-
131
-
132
-
133
-
134
-
135
-
136
-
137
-
138
-
139
-
140
-
141
-
142
-
143
-
144
-
145
-
146
-
147
-
148
-
149
-
150
-
151
-
152
 |
 |

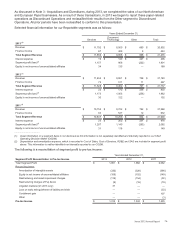
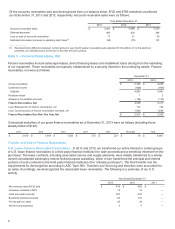
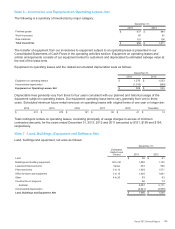
As discussed in Note 3 - Acquisitions and Divestitures, during 2013, we completed the sales of our North American
and European Paper businesses. As a result of these transactions, in 2013 we began to report these paper-related
operations as Discontinued Operations and reclassified their results from the Other segment to Discontinued
Operations. All prior periods have been reclassified to conform to this presentation.
Selected financial information for our Reportable segments was as follows:
Years Ended December 31,
Services
Document
Technology Other Total
2013 (1)
Revenue $11,792 $8,500 $660 $20,952
Finance income 67 408 8 483
Total Segment Revenue $11,859 $8,908 $668 $21,435
Interest expense $ 19 $ 140 $247 $406
Segment profit (loss)(2) 1,157 966 (222)1,901
Equity in net income of unconsolidated affiliates 34 135 — 169
2012 (1)
Revenue $11,453 $8,951 $736 $21,140
Finance income 75 511 11 597
Total Segment Revenue $11,528 $9,462 $747 $21,737
Interest expense $ 22 $ 172 $236 $430
Segment profit (loss)(2) 1,173 1,065 (256)1,982
Equity in net income of unconsolidated affiliates 30 122 — 152
2011 (1)
Revenue $10,754 $9,722 $792 $21,268
Finance income 83 537 12 632
Total Segment Revenue $10,837 $10,259 $804 $21,900
Interest expense $ 25 $ 202 $251 $478
Segment profit (loss)(2) 1,207 1,140 (285)2,062
Equity in net income of unconsolidated affiliates 31 118 — 149
____________________________
(1) Asset information on a segment basis is not disclosed as this information is not separately identified and internally reported to our Chief
Operating Decision Maker (CODM).
(2) Depreciation and amortization expense, which is recorded in Cost of Sales, Cost of Services, RD&E and SAG are included in segment profit
above. This information is neither identified nor internally reported to our CODM.
The following is a reconciliation of segment profit to pre-tax income:
Years Ended December 31,
Segment Profit Reconciliation to Pre-tax Income 2013 2012 2011
Total Segment Profit $1,901 $1,982 $2,062
Reconciling items:
Amortization of intangible assets (332)(328)(398)
Equity in net income of unconsolidated affiliates (169)(152)(149)
Restructuring and asset impairment charges (116)(154)(32)
Restructuring charges of Fuji Xerox (9) (16)(19)
Litigation matters (Q1 2013 only) 37 — —
Loss on early extinguishment of liability and debt —— (33)
Curtailment gain —— 107
Other ——(3)
Pre-tax Income $1,312 $1,332 $1,535
Xerox 2013 Annual Report 76