Xerox 2013 Annual Report Download - page 104
Download and view the complete annual report
Please find page 104 of the 2013 Xerox annual report below. You can navigate through the pages in the report by either clicking on the pages listed below, or by using the keyword search tool below to find specific information within the annual report.-
 1
1 -
2
-
3
-
4
-
5
-
6
-
7
-
8
-
9
-
10
-
11
-
12
-
13
-
14
-
15
-
16
-
17
-
18
-
19
-
20
-
21
-
22
-
23
-
24
-
25
-
26
-
27
-
28
-
29
-
30
-
31
-
32
-
33
-
34
-
35
-
36
-
37
-
38
-
39
-
40
-
41
-
42
-
43
-
44
-
45
-
46
-
47
-
48
-
49
-
50
-
51
-
52
-
53
-
54
-
55
-
56
-
57
-
58
-
59
-
60
-
61
-
62
-
63
-
64
-
65
-
66
-
67
-
68
-
69
-
70
-
71
-
72
-
73
-
74
-
75
-
76
-
77
-
78
-
79
-
80
-
81
-
82
-
83
-
84
-
85
-
86
-
87
-
88
-
89
-
90
-
91
-
92
-
93
-
 94
94 -
 95
95 -
 96
96 -
 97
97 -
 98
98 -
 99
99 -
 100
100 -
 101
101 -
 102
102 -
 103
103 -
 104
104 -
 105
105 -
 106
106 -
 107
107 -
 108
108 -
 109
109 -
 110
110 -
 111
111 -
 112
112 -
 113
113 -
 114
114 -
115
-
116
-
117
-
118
-
119
-
120
-
121
-
122
-
123
-
124
-
125
-
126
-
127
-
128
-
129
-
130
-
131
-
132
-
133
-
134
-
135
-
136
-
137
-
138
-
139
-
140
-
141
-
142
-
143
-
144
-
145
-
146
-
147
-
148
-
149
-
150
-
151
-
152
 |
 |
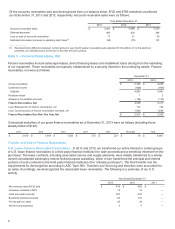
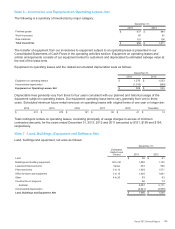
Depreciation expense and operating lease rent expense were as follows:
Year Ended December 31,
2013 2012 2011
Depreciation expense $ 431 $452 $405
Operating lease rent expense(1) 754 646 681
_____________________________
(1) We lease certain land, buildings and equipment, substantially all of which are accounted for as operating leases. Capital leased assets were
approximately $150 and $80 at December 31, 2013 and 2012, respectively.
Future minimum operating lease commitments that have initial or remaining non-cancelable lease terms in excess
of one year at December 31, 2013 were as follows:
2014 2015 2016 2017 2018 Thereafter
$ 579 $ 467 $ 304 $ 122 $ 72 $ 92
Internal Use and Product Software
Year Ended December 31,
Additions to: 2013 2012 2011
Internal use software $ 81 $ 125 $163
Product software 37 107 108
December 31,
Capitalized costs, net: 2013 2012
Internal use software $ 506 $577
Product software 343 344
Useful lives of our internal use and product software generally vary from three to ten years.
Included within product software at December 31, 2013 is approximately $250 of capitalized costs associated with
significant software systems developed for use in certain of our government services businesses. We regularly
review these software systems for impairment. Our impairment review for 2013 and 2012 indicated that the costs
will be recoverable from estimated future operating profits; however, those future operating profits are heavily
dependent on our ability to successfully obtain future contracts.
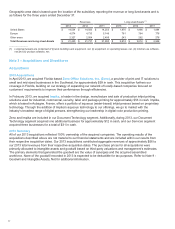
Note 8 – Investment in Affiliates, at Equity
Investments in corporate joint ventures and other companies in which we generally have a 20% to 50% ownership
interest were as follows:
December 31,
2013 2012
Fuji Xerox $ 1,224 $1,317
All other equity investments 61 64
Investments in Affiliates, at Equity $1,285 $1,381
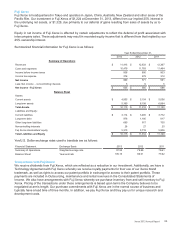
Our equity in net income of our unconsolidated affiliates was as follows:
Year Ended December 31,
2013 2012 2011
Fuji Xerox $156 $139 $137
Other investments 13 13 12
Total Equity in Net Income of Unconsolidated Affiliates $169 $152 $149
87