Xerox 2013 Annual Report Download - page 75
Download and view the complete annual report
Please find page 75 of the 2013 Xerox annual report below. You can navigate through the pages in the report by either clicking on the pages listed below, or by using the keyword search tool below to find specific information within the annual report.-
 1
1 -
2
-
3
-
4
-
5
-
6
-
7
-
8
-
9
-
10
-
11
-
12
-
13
-
14
-
15
-
16
-
17
-
18
-
19
-
20
-
21
-
22
-
23
-
24
-
25
-
26
-
27
-
28
-
29
-
30
-
31
-
32
-
33
-
34
-
35
-
36
-
37
-
38
-
39
-
40
-
41
-
42
-
43
-
44
-
45
-
46
-
47
-
48
-
49
-
50
-
51
-
52
-
53
-
54
-
55
-
56
-
57
-
58
-
59
-
60
-
61
-
62
-
63
-
64
-
 65
65 -
 66
66 -
 67
67 -
 68
68 -
 69
69 -
 70
70 -
 71
71 -
 72
72 -
 73
73 -
 74
74 -
 75
75 -
 76
76 -
 77
77 -
 78
78 -
 79
79 -
 80
80 -
 81
81 -
 82
82 -
 83
83 -
 84
84 -
 85
85 -
86
-
87
-
88
-
89
-
90
-
91
-
92
-
93
-
94
-
95
-
96
-
97
-
98
-
99
-
100
-
101
-
102
-
103
-
104
-
105
-
106
-
107
-
108
-
109
-
110
-
111
-
112
-
113
-
114
-
115
-
116
-
117
-
118
-
119
-
120
-
121
-
122
-
123
-
124
-
125
-
126
-
127
-
128
-
129
-
130
-
131
-
132
-
133
-
134
-
135
-
136
-
137
-
138
-
139
-
140
-
141
-
142
-
143
-
144
-
145
-
146
-
147
-
148
-
149
-
150
-
151
-
152
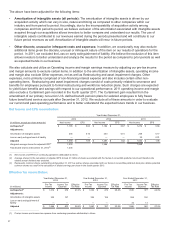
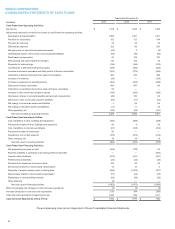
 |
 |

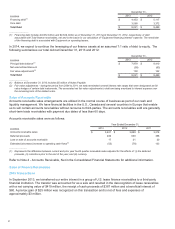
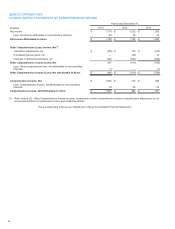
Operating Income / Margin reconciliation:
Year Ended December 31, 2013 Year Ended December 31, 2012 Year Ended December 31, 2011
(in millions) Profit Revenue Margin Profit Revenue Margin Profit Revenue Margin
Reported Pre-tax Income(1) $ 1,312 $ 21,435 6.1% $ 1,332 $ 21,737 6.1% $ 1,535 $ 21,900 7.0%
Adjustments:
Amortization of intangible assets 332 328 398
Xerox restructuring charge 116 154 32
Curtailment gain — — (107)
Other expenses, net 150 261 326
Adjusted Operating Income /
Margin 1,910 21,435 8.9% 2,075 21,737 9.5% 2,184 21,900 10.0%
Equity in net income of unconsolidated
affiliates 169 152 149
Fuji Xerox restructuring charge 9 16 19
Litigation matters (Q1 2013 only) (37) — —
Loss on early extinguishment of
liability — — 33
Other expense, net* (150) (261) (323)
Segment Profit / Margin 1,901 21,435 8.9% 1,982 21,737 9.1% 2,062 21,900 9.4%
____________________________
* Includes rounding adjustments.
(1) Profit and revenue from continuing operations attributable to Xerox.
ITEM 7A. QUANTITATIVE AND QUALITATIVE DISCLOSURES ABOUT MARKET RISK
Financial Risk Management
We are exposed to market risk from foreign currency exchange rates and interest rates, which could affect
operating results, financial position and cash flows. We manage our exposure to these market risks through our
regular operating and financing activities and, when appropriate, through the use of derivative financial instruments.
We utilized derivative financial instruments to hedge economic exposures, as well as reduce earnings and cash flow
volatility resulting from shifts in market rates.
Recent market events have not caused us to materially modify or change our financial risk management strategies
with respect to our exposures to interest rate and foreign currency risk. Refer to Note 13 - Financial Instruments in
the Consolidated Financial Statements for additional discussion on our financial risk management.
Foreign Exchange Risk Management
Assuming a 10% appreciation or depreciation in foreign currency exchange rates from the quoted foreign currency
exchange rates at December 31, 2013, the potential change in the fair value of foreign currency-denominated
assets and liabilities in each entity would not be significant because all material currency asset and liability
exposures were economically hedged as of December 31, 2013. A 10% appreciation or depreciation of the U.S.
Dollar against all currencies from the quoted foreign currency exchange rates at December 31, 2013 would have an
impact on our cumulative translation adjustment portion of equity of approximately $655 million. The net amount
invested in foreign subsidiaries and affiliates, primarily Xerox Limited, Fuji Xerox and Xerox Canada Inc. and
translated into U.S. Dollars using the year-end exchange rates, was approximately $6.6 billion at December 31,
2013.
Xerox 2013 Annual Report 58