Xerox 2013 Annual Report Download - page 55
Download and view the complete annual report
Please find page 55 of the 2013 Xerox annual report below. You can navigate through the pages in the report by either clicking on the pages listed below, or by using the keyword search tool below to find specific information within the annual report.-
 1
1 -
2
-
3
-
4
-
5
-
6
-
7
-
8
-
9
-
10
-
11
-
12
-
13
-
14
-
15
-
16
-
17
-
18
-
19
-
20
-
21
-
22
-
23
-
24
-
25
-
26
-
27
-
28
-
29
-
30
-
31
-
32
-
33
-
34
-
35
-
36
-
37
-
38
-
39
-
40
-
41
-
42
-
43
-
44
-
 45
45 -
 46
46 -
 47
47 -
 48
48 -
 49
49 -
 50
50 -
 51
51 -
 52
52 -
 53
53 -
 54
54 -
 55
55 -
 56
56 -
 57
57 -
 58
58 -
 59
59 -
 60
60 -
 61
61 -
 62
62 -
 63
63 -
 64
64 -
 65
65 -
66
-
67
-
68
-
69
-
70
-
71
-
72
-
73
-
74
-
75
-
76
-
77
-
78
-
79
-
80
-
81
-
82
-
83
-
84
-
85
-
86
-
87
-
88
-
89
-
90
-
91
-
92
-
93
-
94
-
95
-
96
-
97
-
98
-
99
-
100
-
101
-
102
-
103
-
104
-
105
-
106
-
107
-
108
-
109
-
110
-
111
-
112
-
113
-
114
-
115
-
116
-
117
-
118
-
119
-
120
-
121
-
122
-
123
-
124
-
125
-
126
-
127
-
128
-
129
-
130
-
131
-
132
-
133
-
134
-
135
-
136
-
137
-
138
-
139
-
140
-
141
-
142
-
143
-
144
-
145
-
146
-
147
-
148
-
149
-
150
-
151
-
152
 |
 |
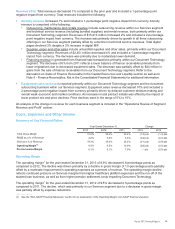
RD&E of $655 million for the year ended December 31, 2012, was $64 million lower, reflecting the impact of
restructuring and productivity improvements.
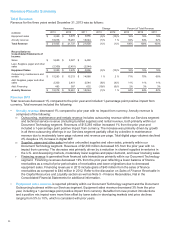
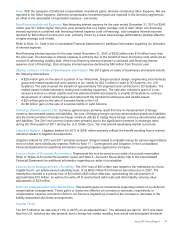
Selling, Administrative and General Expenses (SAG)
SAG as a percent of revenue of 19.3% decreased 0.1-percentage point for the year ended December 31, 2013.
SAG expenses of $4,137 million for the year ended December 31, 2013 were $79 million lower than the prior year
period. The decrease in SAG expense reflects the following:
• $61 million decrease in selling expenses reflecting the benefits from restructuring and productivity
improvements, as well as lower compensation-related expenses and advertising spending partially offset by the
impact of acquisitions.
• $19 million decrease in general and administrative expenses as restructuring savings and productivity
improvements were partially offset by the impact of acquisitions and increased consulting costs.
• $1 million increase in bad debt expenses to $120 million.
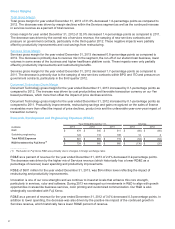
SAG as a percent of revenue of 19.4% decreased 0.8-percentage points for the year ended December 31, 2012.
The decrease was driven by spending reductions reflecting benefits from restructuring and productivity
improvements in addition to the positive mix impact from the continued growth in Services revenue, which
historically has a lower SAG percent to revenue.
SAG expenses of $4,216 million for the year ended December 31, 2012 was $205 million lower than the prior year
period including a $60 million favorable impact from currency. The SAG expense decrease reflects the following:
• $236 million decrease in selling expenses reflecting the benefits from restructuring, productivity improvements
and decrease in brand advertising partially offset by the impact of acquisitions.
• $69 million increase in general and administrative expenses, as restructuring savings and productivity
improvements were more than offset by the impact of acquisitions and deferred compensation expense.
• $38 million decrease in bad debt expense to $119 million, driven primarily by lower write-offs in Europe.
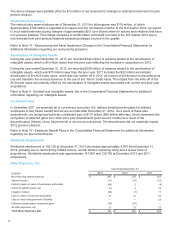
Restructuring and Asset Impairment Charges
During the year ended December 31, 2013, we recorded net restructuring and asset impairment charges of $116
million ($81 million after-tax). Approximately 34% of the charges were related to our Services segment and 66% to
our Document Technology segment and included the following:
• $142 million of severance costs related to headcount reductions of approximately 4,900 employees globally.
The actions impacted several functional areas, and approximately 65% of the costs were focused on gross
margin improvements, 34% on SAG and 1% on the optimization of RD&E investments.
• $2 million for lease termination costs primarily reflecting continued optimization of our worldwide operating
locations.
• $1 million of asset impairment losses.
The above charges were partially offset by $29 million of net reversals for changes in estimated reserves from prior
period initiatives.
We expect 2014 pre-tax savings of approximately $150 million from our 2013 restructuring actions.
During the year ended December 31, 2012, we recorded net restructuring and asset impairment charges of $154
million ($98 million after-tax). Approximately 46% of the charges were related to our Services segment and 54% to
our Document Technology segment and included the following:
• $161 million of severance costs related to headcount reductions of approximately 6,300 employees primarily in
North America. The actions impacted several functional areas, and approximately 63% of the costs were
focused on gross margin improvements, 31% on SAG and 6% on the optimization of RD&E investments.
• $5 million for lease termination costs primarily reflecting continued optimization of our worldwide operating
locations.
• $2 million of asset impairment losses.
Xerox 2013 Annual Report 38