Xerox 2013 Annual Report Download - page 65
Download and view the complete annual report
Please find page 65 of the 2013 Xerox annual report below. You can navigate through the pages in the report by either clicking on the pages listed below, or by using the keyword search tool below to find specific information within the annual report.-
 1
1 -
2
-
3
-
4
-
5
-
6
-
7
-
8
-
9
-
10
-
11
-
12
-
13
-
14
-
15
-
16
-
17
-
18
-
19
-
20
-
21
-
22
-
23
-
24
-
25
-
26
-
27
-
28
-
29
-
30
-
31
-
32
-
33
-
34
-
35
-
36
-
37
-
38
-
39
-
40
-
41
-
42
-
43
-
44
-
45
-
46
-
47
-
48
-
49
-
50
-
51
-
52
-
53
-
54
-
 55
55 -
 56
56 -
 57
57 -
 58
58 -
 59
59 -
 60
60 -
 61
61 -
 62
62 -
 63
63 -
 64
64 -
 65
65 -
 66
66 -
 67
67 -
 68
68 -
 69
69 -
 70
70 -
 71
71 -
 72
72 -
 73
73 -
 74
74 -
 75
75 -
76
-
77
-
78
-
79
-
80
-
81
-
82
-
83
-
84
-
85
-
86
-
87
-
88
-
89
-
90
-
91
-
92
-
93
-
94
-
95
-
96
-
97
-
98
-
99
-
100
-
101
-
102
-
103
-
104
-
105
-
106
-
107
-
108
-
109
-
110
-
111
-
112
-
113
-
114
-
115
-
116
-
117
-
118
-
119
-
120
-
121
-
122
-
123
-
124
-
125
-
126
-
127
-
128
-
129
-
130
-
131
-
132
-
133
-
134
-
135
-
136
-
137
-
138
-
139
-
140
-
141
-
142
-
143
-
144
-
145
-
146
-
147
-
148
-
149
-
150
-
151
-
152
 |
 |

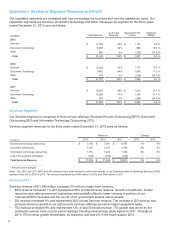
(in millions) Total Revenue
Segment Profit
(Loss)
Segment
Margin
2012
Other segment - restated $ 747 $(256) (34.3)%
Other segment - as reported 1,400 (241) (17.2)%
Total segments - restated 21,737 1,982 9.1 %
Total segments - as reported 22,390 1,997 8.9 %
2011
Other segment - restated $ 804 $(285) (35.4)%
Other segment - as reported 1,530 (255) (16.7)%
Total segments - restated 21,900 2,062 9.4 %
Total segments - as reported 22,626 2,092 9.2 %
Capital Resources and Liquidity
Our liquidity is primarily dependent on our ability to continue to generate strong cash flows from operations.
Additional liquidity is also provided through access to the financial capital markets, including the Commercial Paper
market, as well as a committed global credit facility. The following is a summary of our liquidity position:
• As of December 31, 2013 and 2012, total cash and cash equivalents were $1,764 million and $1,246 million,
respectively, and there were no outstanding borrowings under our Commercial Paper Program in either year.
There were also no borrowings or letters of credit under our $2 billion Credit Facility at either year end. The
increase in our cash balance in 2013 is primarily due to a lower level of acquisitions, proceeds from the sales of
businesses and assets and a Senior Note borrowing in December 2013. See "Capital Markets Activity" section
below.
• Over the past three years we have consistently delivered strong cash flows from operations driven by the
strength of our annuity-based revenue model. Cash flows from operations were $2,375 million, $2,580 million
and $1,961 million in each of the years in the three year period ended December 31, 2013, respectively.
• We expect cash flows from operations to be between $1.8 and $2.0 billion for 2014, which include the adverse
impact of prior period sales of finance receivables of approximately $400 million. No additional sales of finance
receivables are planned for 2014. Cash flows from operations are expected to benefit from profit improvement
in our Services Segment as well as improvements in working capital (accounts receivables, inventory and
accounts payable). Consistent with our normal cash flows seasonality, we expect the first quarter 2014 cash
flows from operations to be the lowest of the year with sources roughly offsetting uses.
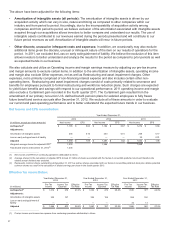
Cash Flow Analysis
The following summarizes our cash flows for the three years ended December 31, 2013, as reported in our
Consolidated Statements of Cash Flows in the accompanying Consolidated Financial Statements:
Year Ended December 31, Change
(in millions) 2013 2012 2011 2013 2012
Net cash provided by operating activities $2,375 $2,580 $1,961 $ (205) $ 619
Net cash used in investing activities (452)(761)(675) 309 (86)
Net cash used in financing activities (1,402) (1,472) (1,586) 70 114
Effect of exchange rate changes on cash and cash equivalents (3) (3) (9) — 6
Increase (decrease) in cash and cash equivalents 518 344 (309) 174 653
Cash and cash equivalents at beginning of year 1,246 902 1,211 344 (309)
Cash and Cash Equivalents at End of Year $1,764 $1,246 $902 $ 518 $ 344
Xerox 2013 Annual Report 48