Xerox 2013 Annual Report Download - page 134
Download and view the complete annual report
Please find page 134 of the 2013 Xerox annual report below. You can navigate through the pages in the report by either clicking on the pages listed below, or by using the keyword search tool below to find specific information within the annual report.-
 1
1 -
2
-
3
-
4
-
5
-
6
-
7
-
8
-
9
-
10
-
11
-
12
-
13
-
14
-
15
-
16
-
17
-
18
-
19
-
20
-
21
-
22
-
23
-
24
-
25
-
26
-
27
-
28
-
29
-
30
-
31
-
32
-
33
-
34
-
35
-
36
-
37
-
38
-
39
-
40
-
41
-
42
-
43
-
44
-
45
-
46
-
47
-
48
-
49
-
50
-
51
-
52
-
53
-
54
-
55
-
56
-
57
-
58
-
59
-
60
-
61
-
62
-
63
-
64
-
65
-
66
-
67
-
68
-
69
-
70
-
71
-
72
-
73
-
74
-
75
-
76
-
77
-
78
-
79
-
80
-
81
-
82
-
83
-
84
-
85
-
86
-
87
-
88
-
89
-
90
-
91
-
92
-
93
-
94
-
95
-
96
-
97
-
98
-
99
-
100
-
101
-
102
-
103
-
104
-
105
-
106
-
107
-
108
-
109
-
110
-
111
-
112
-
113
-
114
-
115
-
116
-
117
-
118
-
119
-
120
-
121
-
122
-
123
-
 124
124 -
 125
125 -
 126
126 -
 127
127 -
 128
128 -
 129
129 -
 130
130 -
 131
131 -
 132
132 -
 133
133 -
 134
134 -
 135
135 -
 136
136 -
 137
137 -
 138
138 -
 139
139 -
 140
140 -
 141
141 -
 142
142 -
 143
143 -
 144
144 -
145
-
146
-
147
-
148
-
149
-
150
-
151
-
152
 |
 |

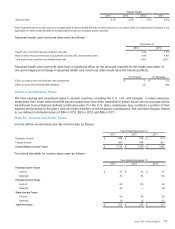
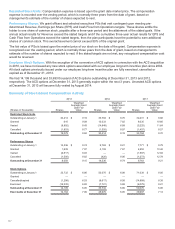
Restricted Stock Units: Compensation expense is based upon the grant date market price. The compensation
expense is recorded over the vesting period, which is normally three years from the date of grant, based on
management's estimate of the number of shares expected to vest.
Performance Shares: We grant officers and selected executives PSs that vest contingent upon meeting pre-
determined Revenue, Earnings per Share (EPS) and Cash Flow from Operations targets. These shares entitle the
holder to one share of common stock, payable after a three-year period and the attainment of the stated goals. If the
annual actual results for Revenue exceed the stated targets and if the cumulative three-year actual results for EPS and
Cash Flow from Operations exceed the stated targets, then the plan participants have the potential to earn additional
shares of common stock. This overachievement cannot exceed 50% of the original grant.
The fair value of PSs is based upon the market price of our stock on the date of the grant. Compensation expense is
recognized over the vesting period, which is normally three years from the date of grant, based on management's
estimate of the number of shares expected to vest. If the stated targets are not met, any recognized compensation cost
would be reversed.
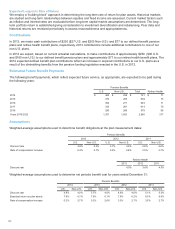
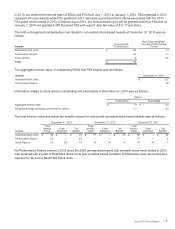
Employee Stock Options: With the exception of the conversion of ACS options in connection with the ACS acquisition
in 2010, we have not issued any new stock options associated with our employee long-term incentive plan since 2004.
All stock options previously issued under our employee long-term incentive plan are fully exercised, cancelled or
expired as of December 31, 2013.
We had 14,199 thousand and 33,693 thousand of ACS options outstanding at December 31, 2013 and 2012,
respectively. The ACS options at December 31, 2013 generally expire within the next 3 years. Unvested ACS options
at December 31, 2013 will become fully vested by August 2014.
Summary of Stock-based Compensation Activity
2013 2012 2011
(Shares in thousands) Shares
Weighted
Average Grant
Date Fair
Value Shares
Weighted
Average Grant
Date Fair
Value Shares
Weighted
Average Grant
Date Fair
Value
Restricted Stock Units
Outstanding at January 1 30,414 $ 9.19 33,784 $8.70 32,431 $ 8.68
Granted 610 9.09 13,033 7.82 8,035 10.66
Vested (9,992) 8.43 (14,848) 6.89 (5,225) 11.64
Cancelled (1,953) 8.77 (1,555) 8.97 (1,457) 8.57
Outstanding at December 31 19,079 9.62 30,414 9.19 33,784 8.70
Performance Shares
Outstanding at January 1 14,536 $ 8.74 9,763 $9.21 7,771 $ 9.78
Granted 1,839 7.97 5,193 7.87 4,852 10.42
Vested (6,817) 8.03 — — (1,587) 12.84
Cancelled (1,500) 8.82 (420)8.96 (1,273) 12.79
Outstanding at December 31 8,058 9.15 14,536 8.74 9,763 9.21
Stock Options
Outstanding at January 1 33,732 $ 6.86 50,070 $6.98 71,038 $ 8.00
Granted — — — — — —
Cancelled/expired (1,298) 6.53 (8,617) 8.58 (14,889) 8.38
Exercised (18,235) 6.82 (7,721) 5.69 (6,079) 8.21
Outstanding at December 31 14,199 6.95 33,732 6.86 50,070 6.98
Exercisable at December 31 12,164 7.06 28,676 6.95 39,987 7.14
117