Xerox 2013 Annual Report Download - page 122
Download and view the complete annual report
Please find page 122 of the 2013 Xerox annual report below. You can navigate through the pages in the report by either clicking on the pages listed below, or by using the keyword search tool below to find specific information within the annual report.-
 1
1 -
2
-
3
-
4
-
5
-
6
-
7
-
8
-
9
-
10
-
11
-
12
-
13
-
14
-
15
-
16
-
17
-
18
-
19
-
20
-
21
-
22
-
23
-
24
-
25
-
26
-
27
-
28
-
29
-
30
-
31
-
32
-
33
-
34
-
35
-
36
-
37
-
38
-
39
-
40
-
41
-
42
-
43
-
44
-
45
-
46
-
47
-
48
-
49
-
50
-
51
-
52
-
53
-
54
-
55
-
56
-
57
-
58
-
59
-
60
-
61
-
62
-
63
-
64
-
65
-
66
-
67
-
68
-
69
-
70
-
71
-
72
-
73
-
74
-
75
-
76
-
77
-
78
-
79
-
80
-
81
-
82
-
83
-
84
-
85
-
86
-
87
-
88
-
89
-
90
-
91
-
92
-
93
-
94
-
95
-
96
-
97
-
98
-
99
-
100
-
101
-
102
-
103
-
104
-
105
-
106
-
107
-
108
-
109
-
110
-
111
-
 112
112 -
 113
113 -
 114
114 -
 115
115 -
 116
116 -
 117
117 -
 118
118 -
 119
119 -
 120
120 -
 121
121 -
 122
122 -
 123
123 -
 124
124 -
 125
125 -
 126
126 -
 127
127 -
 128
128 -
 129
129 -
 130
130 -
 131
131 -
 132
132 -
133
-
134
-
135
-
136
-
137
-
138
-
139
-
140
-
141
-
142
-
143
-
144
-
145
-
146
-
147
-
148
-
149
-
150
-
151
-
152
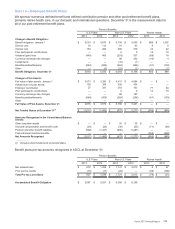
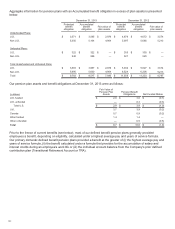
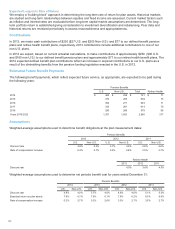
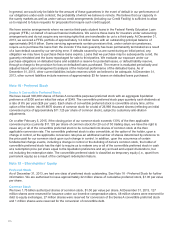
 |
 |

December 31, 2012
U.S. Plans Non-U.S. Plans
Asset Class Level 1 Level 2 Level 3 Total % Level 1 Level 2 Level 3 Total %
Cash and cash equivalents $ 48 $ — $ — $ 48 1% $ 500 $ — $ — $ 500 9%
Equity Securities:
U.S. large cap 411 10 — 421 12% 204 50 — 254 5%
Xerox common stock 99 — — 99 3% — — — — —%
U.S. mid cap 79 — — 79 2% 14 — — 14 —%
U.S. small cap 67 28 — 95 3% 30 1 — 31 1%
International developed 133 205 — 338 9% 1,107 174 — 1,281 24%
Emerging markets 282 67 — 349 10% 322 76 — 398 7%
Global equity 2 6 — 8 —% 5 12 — 17 —%
Total Equity Securities 1,073 316 — 1,389 39% 1,682 313 — 1,995 37%
Fixed Income:
U.S. treasury securities — 367 — 367 10% 1 19 — 20 —%
Debt security issued by
government agency — 153 — 153 4% 35 1,253 — 1,288 24%
Corporate bonds — 1,080 — 1,080 31% 150 753 — 903 17%
Asset backed securities — 11 — 11 —% 3 31 — 34 1%
Total Debt Securities — 1,611 — 1,611 45% 189 2,056 — 2,245 42%
Common/Collective trust — — — — —% 2 — — 2 —%
Derivatives:
Interest rate contracts — 15 — 15 —% — 74 — 74 1%
Foreign exchange contracts (2) — — (2) —% 9 8 — 17 —%
Equity contracts 5 — — 5 —% — — — — —%
Credit contracts — (1) — (1) —% — — — — —%
Other contracts — — — — —% 69 — — 69 1%
Total Derivatives 3 14 — 17 —% 78 82 — 160 2%
Hedge funds — — — — —% — — 3 3 —%
Real estate 59 46 58 163 5% 19 35 332 386 7%
Private equity/Venture capital — — 300 300 8% — — — — —%
Guaranteed insurance contracts — — — — —% — — 131 131 3%
Other(1) 12 33 — 45 2% 13 (4) — 9 —%
Total Fair Value Of Plans
Assets $ 1,195 $ 2,020 $ 358 $ 3,573 100% $ 2,483 $ 2,482 $ 466 $ 5,431 100%
_____________________________
(1) Other Level 1 assets include net non-financial liabilities of $13 U.S. and $5 Non-U.S., such as due to/from broker, interest receivables and
accrued expenses.
105