Xerox 2013 Annual Report Download - page 61
Download and view the complete annual report
Please find page 61 of the 2013 Xerox annual report below. You can navigate through the pages in the report by either clicking on the pages listed below, or by using the keyword search tool below to find specific information within the annual report.-
 1
1 -
2
-
3
-
4
-
5
-
6
-
7
-
8
-
9
-
10
-
11
-
12
-
13
-
14
-
15
-
16
-
17
-
18
-
19
-
20
-
21
-
22
-
23
-
24
-
25
-
26
-
27
-
28
-
29
-
30
-
31
-
32
-
33
-
34
-
35
-
36
-
37
-
38
-
39
-
40
-
41
-
42
-
43
-
44
-
45
-
46
-
47
-
48
-
49
-
50
-
 51
51 -
 52
52 -
 53
53 -
 54
54 -
 55
55 -
 56
56 -
 57
57 -
 58
58 -
 59
59 -
 60
60 -
 61
61 -
 62
62 -
 63
63 -
 64
64 -
 65
65 -
 66
66 -
 67
67 -
 68
68 -
 69
69 -
 70
70 -
 71
71 -
72
-
73
-
74
-
75
-
76
-
77
-
78
-
79
-
80
-
81
-
82
-
83
-
84
-
85
-
86
-
87
-
88
-
89
-
90
-
91
-
92
-
93
-
94
-
95
-
96
-
97
-
98
-
99
-
100
-
101
-
102
-
103
-
104
-
105
-
106
-
107
-
108
-
109
-
110
-
111
-
112
-
113
-
114
-
115
-
116
-
117
-
118
-
119
-
120
-
121
-
122
-
123
-
124
-
125
-
126
-
127
-
128
-
129
-
130
-
131
-
132
-
133
-
134
-
135
-
136
-
137
-
138
-
139
-
140
-
141
-
142
-
143
-
144
-
145
-
146
-
147
-
148
-
149
-
150
-
151
-
152
 |
 |

Segment Margin 2013
Services segment margin of 9.8% decreased 0.4-percentage points from the prior year primarily due to a 0.8-
percentage point decline in gross margin as increased productivity improvements and restructuring benefits were
more than offset by the run-off of the student loan business, higher healthcare platform expenses, the impact of
price declines, which were consistent with prior years, and lower volumes. The gross margin decline was partially
offset by SAG improvements reflecting restructuring benefits as well as lower compensation-related expenses.
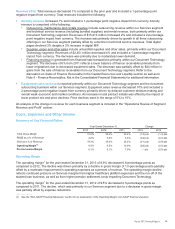
Metrics
Pipeline
Our total services sales pipeline at December 31, 2013, grew 9% over the prior year. This sales pipeline includes
the Total Contract Value (TCV) of new business opportunities that potentially could be contracted within the next six
months and excludes business opportunities with estimated annual recurring revenue in excess of $100 million.
Signings
Signings are defined as estimated future revenues from contracts signed during the period, including renewals of
existing contracts. TCV represents the estimated future contract revenue for pipeline or signed contracts for
signings, as applicable.
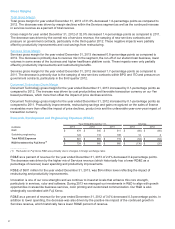
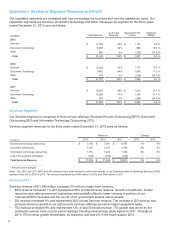
Signings were as follows:
Year Ended December 31,
(in billions) 2013 2012(1)
BPO $ 8.9 $ 6.5
DO 3.3 2.9
ITO 1.0 1.5
Total Signings $13.2 $10.9
_________
(1) The 2012 BPO and DO signings have been revised to reflect the transfer of our Communication & Marketing Services (CMS) business from
DO to BPO in 2013.
Services signings were an estimated $13.2 billion in TCV for 2013 and increased 21% compared to the prior year.
The increase was driven by new business and higher renewals.
Services signings were an estimated at $10.9 billion in TCV for 2012 and decreased 25% compared to the prior
year. This decline was driven by a decrease in large deals from the prior year as well as delays in customer
decision making. While the total number of BPO/ITO contracts signed in 2012 increased from 2011, the decline in
large deals drove a reduction in the average contract length of new business signings in 2012.
The above DO signings amount represents Enterprise signings only and does not include signings from our partner
print services offerings, which is driving the revenue growth in DO.
Note: TCV is the estimated total contractual revenue related to future contracts in the pipeline or signed contracts,
as applicable.
Renewal rate (BPO and ITO only)
Renewal rate is defined as the annual recurring revenue (ARR) on contracts that are renewed during the period as
a percentage of ARR on all contracts on which a renewal decision was made during the period. Our 2013 renewal
rate of 92% was above our target range of 85%-90% and 7-percentage points higher than 2012. Our 2012 renewal
rate of 85% was 5-percentage points higher than our 2011 renewal rate of 80%.
Revenue 2012
Services revenue of $11,528 million increased 6% with a 1-percentage point negative impact from currency.
• BPO revenue increased 9%, including a 1-percentage point negative impact from currency, and represented
57% of total Services revenue. BPO growth was driven by the government healthcare, healthcare payer,
customer care, financial services, retail, travel and insurance businesses and other state government solutions,
as well as the benefits from recent acquisitions.
Xerox 2013 Annual Report 44