Xerox 2013 Annual Report Download - page 54
Download and view the complete annual report
Please find page 54 of the 2013 Xerox annual report below. You can navigate through the pages in the report by either clicking on the pages listed below, or by using the keyword search tool below to find specific information within the annual report.-
 1
1 -
2
-
3
-
4
-
5
-
6
-
7
-
8
-
9
-
10
-
11
-
12
-
13
-
14
-
15
-
16
-
17
-
18
-
19
-
20
-
21
-
22
-
23
-
24
-
25
-
26
-
27
-
28
-
29
-
30
-
31
-
32
-
33
-
34
-
35
-
36
-
37
-
38
-
39
-
40
-
41
-
42
-
43
-
 44
44 -
 45
45 -
 46
46 -
 47
47 -
 48
48 -
 49
49 -
 50
50 -
 51
51 -
 52
52 -
 53
53 -
 54
54 -
 55
55 -
 56
56 -
 57
57 -
 58
58 -
 59
59 -
 60
60 -
 61
61 -
 62
62 -
 63
63 -
 64
64 -
65
-
66
-
67
-
68
-
69
-
70
-
71
-
72
-
73
-
74
-
75
-
76
-
77
-
78
-
79
-
80
-
81
-
82
-
83
-
84
-
85
-
86
-
87
-
88
-
89
-
90
-
91
-
92
-
93
-
94
-
95
-
96
-
97
-
98
-
99
-
100
-
101
-
102
-
103
-
104
-
105
-
106
-
107
-
108
-
109
-
110
-
111
-
112
-
113
-
114
-
115
-
116
-
117
-
118
-
119
-
120
-
121
-
122
-
123
-
124
-
125
-
126
-
127
-
128
-
129
-
130
-
131
-
132
-
133
-
134
-
135
-
136
-
137
-
138
-
139
-
140
-
141
-
142
-
143
-
144
-
145
-
146
-
147
-
148
-
149
-
150
-
151
-
152
 |
 |

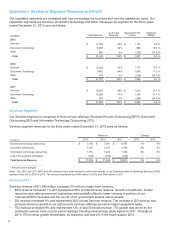
Gross Margins
Total Gross Margin
Total gross margin for year ended December 31, 2013 of 31.0% decreased 1.0-percentage points as compared to
2012. The decrease was driven by margin declines within the Services segment as well as the continued increase
in services revenue as a percent of total revenue.
Gross margin for year ended December 31, 2012 of 32.0% decreased 1.4-percentage points as compared to 2011.
The decrease was driven by the overall mix of services revenue, the ramping of new services contracts and
pressure on government contracts, particularly in the third quarter 2012. These negative impacts were partially
offset by productivity improvements and cost savings from restructuring.
Services Gross Margin
Services gross margin for the year ended December 31, 2013 decreased 0.8-percentage points as compared to
2012. The decrease is primarily due to revenue mix in the segment, the run-off of our student loan business, lower
volumes in some areas of the business and higher healthcare platform costs. These impacts were only partially
offset by productivity improvements and restructuring benefits.
Services gross margin for the year ended December 31, 2012 decreased 1.7-percentage points as compared to
2011. The decrease is primarily due to the ramping of new services contracts within BPO and ITO and pressure on
government contracts, particularly in the third quarter 2012.
Document Technology Gross Margin
Document Technology gross margin for the year ended December 31, 2013 increased by 0.1-percentage points as
compared to 2012. The increase was driven by cost productivities and favorable transaction currency on our Yen
based purchases, which more than offset the impact of price declines and mix.
Document Technology gross margin for the year ended December 31, 2012 increased by 0.1-percentage points as
compared to 2011. Productivity improvements, restructuring savings and gains recognized on the sales of finance
receivables more than offset the impact of price declines, product mix and the unfavorable year-over-year impact of
transaction currency.
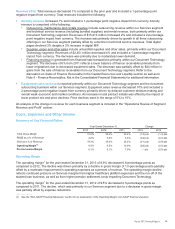
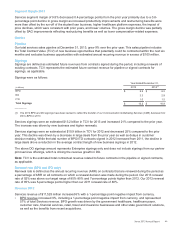
Research, Development and Engineering Expenses (RD&E)
Year Ended December 31, Change
(in millions) 2013 2012 2011 2013 2012
R&D $ 479 $ 545 $611 $(66) $ (66)
Sustaining engineering 122 110 108 12 2
Total RD&E Expenses $ 601 $ 655 $719 $(54) $ (64)
R&D Investment by Fuji Xerox(1) $ 724 $ 860 $880 $(136) $ (20)
______________
(1) Fluctuation in Fuji Xerox R&D was primarily due to changes in foreign exchange rates.
RD&E as a percent of revenue for the year ended December 31, 2013 of 2.8% decreased 0.2-percentage points.
The decrease was driven by the higher mix of Services revenue (which historically has a lower RD&E as a
percentage of revenue) lower spending and productivity improvements.
RD&E of $601 million for the year ended December 31, 2013, was $54 million lower reflecting the impact of
restructuring and productivity improvements.
Innovation is one of our core strengths and we continue to invest at levels that enhance this core strength,
particularly in services, color and software. During 2013 we managed our investments in R&D to align with growth
opportunities in areas like business services, color printing and customized communication. Our R&D is also
strategically coordinated with Fuji Xerox.
RD&E as a percent of revenue for the year ended December 31, 2012 of 3.0% decreased 0.3-percentage points. In
addition to lower spending, the decrease was also driven by the positive mix impact of the continued growth in
Services revenue, which historically has a lower RD&E percent of revenue.
37