Xerox 2013 Annual Report Download - page 53
Download and view the complete annual report
Please find page 53 of the 2013 Xerox annual report below. You can navigate through the pages in the report by either clicking on the pages listed below, or by using the keyword search tool below to find specific information within the annual report.-
 1
1 -
2
-
3
-
4
-
5
-
6
-
7
-
8
-
9
-
10
-
11
-
12
-
13
-
14
-
15
-
16
-
17
-
18
-
19
-
20
-
21
-
22
-
23
-
24
-
25
-
26
-
27
-
28
-
29
-
30
-
31
-
32
-
33
-
34
-
35
-
36
-
37
-
38
-
39
-
40
-
41
-
42
-
 43
43 -
 44
44 -
 45
45 -
 46
46 -
 47
47 -
 48
48 -
 49
49 -
 50
50 -
 51
51 -
 52
52 -
 53
53 -
 54
54 -
 55
55 -
 56
56 -
 57
57 -
 58
58 -
 59
59 -
 60
60 -
 61
61 -
 62
62 -
 63
63 -
64
-
65
-
66
-
67
-
68
-
69
-
70
-
71
-
72
-
73
-
74
-
75
-
76
-
77
-
78
-
79
-
80
-
81
-
82
-
83
-
84
-
85
-
86
-
87
-
88
-
89
-
90
-
91
-
92
-
93
-
94
-
95
-
96
-
97
-
98
-
99
-
100
-
101
-
102
-
103
-
104
-
105
-
106
-
107
-
108
-
109
-
110
-
111
-
112
-
113
-
114
-
115
-
116
-
117
-
118
-
119
-
120
-
121
-
122
-
123
-
124
-
125
-
126
-
127
-
128
-
129
-
130
-
131
-
132
-
133
-
134
-
135
-
136
-
137
-
138
-
139
-
140
-
141
-
142
-
143
-
144
-
145
-
146
-
147
-
148
-
149
-
150
-
151
-
152
 |
 |

Revenue 2012 Total revenues decreased 1% compared to the prior year and included a 1-percentage point
negative impact from currency. Total revenues included the following:
• Annuity revenue increased 1% and included a 1-percentage point negative impact from currency. Annuity
revenue is comprised of the following:
Outsourcing, maintenance and rentals revenue include outsourcing revenue within our Services segment
and technical service revenue (including bundled supplies) and rental revenue, both primarily within our
Document Technology segment. Revenues of $15,213 million increased 2% and included a 2-percentage
point negative impact from currency. The increase was primarily driven by growth in all three outsourcing
offerings in our Services segment partially offset by a decline in technical service revenues. Total digital
pages declined 2% despite a 3% increase in digital MIF.
Supplies, paper and other sales include unbundled supplies and other sales, primarily within our Document
Technology segment. Revenues of $2,451 million decreased 4% and included a 1-percentage negative
impact from currency. The decrease was primarily due to moderately lower demand.
Financing revenue is generated from financed sale transactions primarily within our Document Technology
segment. The decrease of 6% from 2011 reflects a lower balance of finance receivables primarily from
lower originations due to decreased equipment sales. The decrease was partially offset by $44 million in
gains from the sale of finance receivables from our Document Technology segment. Refer to the
discussion on Sales of Finance Receivable in the Capital Resources and Liquidity section as well as to
Note 5 - Finance Receivables, Net in the Consolidated Financial Statements for additional information.
• Equipment sales revenue is reported primarily within our Document Technology segment and the document
outsourcing business within our Services segment. Equipment sales revenue decreased 10% and included a
2-percentage point negative impact from currency primarily driven by delayed customer decision-making and
overall weak economic and market conditions. An increase in total product installs was offset by the impact of
lower product mix and price declines. Price declines were in the range of 5% to 10%.
An analysis of the change in revenue for each business segment is included in the “Operations Review of Segment
Revenue and Profit” section.
Costs, Expenses and Other Income
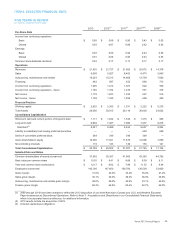
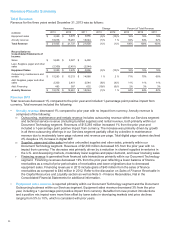
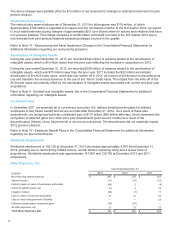
Summary of Key Financial Ratios
Year Ended December 31, Change
2013 2012 2011 2013 2012
Total Gross Margin 31.0%32.0%33.4%(1.0) pts (1.4) pts
RD&E as a % of Revenue 2.8% 3.0% 3.3% (0.2) pts (0.3) pts
SAG as a % of Revenue 19.3%19.4%20.2%(0.1) pts (0.8) pts
Operating Margin(1) 8.9% 9.5% 10.0%(0.6) pts (0.5) pts
Pre-tax Income Margin 6.1% 6.1% 7.0% — pts (0.9) pts
Operating Margin
The operating margin1 for the year ended December 31, 2013 of 8.9% decreased 0.6-percentage points as
compared to 2012. The decline was driven primarily by a decline in gross margin of 1.0-percentage points partially
offset by a moderate improvement in operating expenses as a percent of revenue. The operating margin decline
reflects continued pressure on Services margins from higher healthcare platform expenses and the run-off of the
student loan business, as well as from higher pension settlement costs impacting Document Technology.
The operating margin1 for the year ended December 31, 2012 of 9.5% decreased 0.5-percentage points as
compared to 2011. The decline, which was primarily in our Services segment due to a decrease in gross margin,
was partially offset by expense reductions.
_____________
(1) See the "Non-GAAP Financial Measures" section for an explanation of the Operating Margin non-GAAP financial measure.
Xerox 2013 Annual Report 36