Xerox 2013 Annual Report Download - page 74
Download and view the complete annual report
Please find page 74 of the 2013 Xerox annual report below. You can navigate through the pages in the report by either clicking on the pages listed below, or by using the keyword search tool below to find specific information within the annual report.-
 1
1 -
2
-
3
-
4
-
5
-
6
-
7
-
8
-
9
-
10
-
11
-
12
-
13
-
14
-
15
-
16
-
17
-
18
-
19
-
20
-
21
-
22
-
23
-
24
-
25
-
26
-
27
-
28
-
29
-
30
-
31
-
32
-
33
-
34
-
35
-
36
-
37
-
38
-
39
-
40
-
41
-
42
-
43
-
44
-
45
-
46
-
47
-
48
-
49
-
50
-
51
-
52
-
53
-
54
-
55
-
56
-
57
-
58
-
59
-
60
-
61
-
62
-
63
-
 64
64 -
 65
65 -
 66
66 -
 67
67 -
 68
68 -
 69
69 -
 70
70 -
 71
71 -
 72
72 -
 73
73 -
 74
74 -
 75
75 -
 76
76 -
 77
77 -
 78
78 -
 79
79 -
 80
80 -
 81
81 -
 82
82 -
 83
83 -
 84
84 -
85
-
86
-
87
-
88
-
89
-
90
-
91
-
92
-
93
-
94
-
95
-
96
-
97
-
98
-
99
-
100
-
101
-
102
-
103
-
104
-
105
-
106
-
107
-
108
-
109
-
110
-
111
-
112
-
113
-
114
-
115
-
116
-
117
-
118
-
119
-
120
-
121
-
122
-
123
-
124
-
125
-
126
-
127
-
128
-
129
-
130
-
131
-
132
-
133
-
134
-
135
-
136
-
137
-
138
-
139
-
140
-
141
-
142
-
143
-
144
-
145
-
146
-
147
-
148
-
149
-
150
-
151
-
152
 |
 |

The above have been adjusted for the following items:
• Amortization of intangible assets (all periods): The amortization of intangible assets is driven by our
acquisition activity which can vary in size, nature and timing as compared to other companies within our
industry and from period to period. Accordingly, due to the incomparability of acquisition activity among
companies and from period to period, we believe exclusion of the amortization associated with intangible assets
acquired through our acquisitions allows investors to better compare and understand our results. The use of
intangible assets contributed to our revenues earned during the periods presented and will contribute to our
future period revenues as well. Amortization of intangible assets will recur in future periods.
• Other discrete, unusual or infrequent costs and expenses: In addition, we occasionally may also exclude
additional items given the discrete, unusual or infrequent nature of the item on our results of operations for the
period. In 2011, we excluded the Loss on early extinguishment of liability. We believe the exclusion of this item
allows investors to better understand and analyze the results for the period as compared to prior periods as well
as expected trends in our business.
We also calculate and utilize an Operating income and margin earnings measure by adjusting our pre-tax income
and margin amounts to exclude certain items. In addition to the amortization of intangible assets, operating income
and margin also exclude Other expenses, net as well as Restructuring and asset impairment charges. Other
expenses, net is primarily comprised of non-financing interest expense and also includes certain other non-
operating items. Restructuring and asset impairment charges consist of costs primarily related to severance and
benefits for employees pursuant to formal restructuring and workforce reduction plans. Such charges are expected
to yield future benefits and savings with respect to our operational performance. 2011 operating income and margin
also exclude a Curtailment gain recorded in the fourth quarter 2011. The Curtailment gain resulted from the
amendment of our primary non-union U.S. defined benefit pension plans for salaried employees to fully freeze
future benefit and service accruals after December 31, 2012. We exclude all of these amounts in order to evaluate
our current and past operating performance and to better understand the expected future trends in our business.
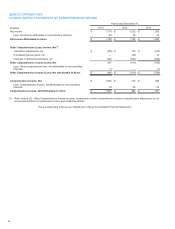
Net Income and EPS reconciliation:
Year Ended December 31,
2013 2012 2011
(in millions; except per share amounts) Net Income EPS Net Income EPS Net Income EPS
As Reported(1) $ 1,185 $ 0.93 $ 1,184 $ 0.87 $ 1,274 $ 0.88
Adjustments:
Amortization of intangible assets 205 0.16 203 0.15 248 0.17
Loss on early extinguishment of liability — — — — 20 0.01
Adjusted $ 1,390 $ 1.09 $ 1,387 $ 1.02 $ 1,542 $ 1.06
Weighted average shares for adjusted EPS(2) 1,274 1,356 1,444
Fully diluted shares at December 31, 2013(3) 1,235
____________________________
(1) Net income and EPS from continuing operations attributable to Xerox.
(2) Average shares for the calculation of adjusted EPS include 27 million of shares associated with the Series A convertible preferred stock and therefore the
related annual dividend was excluded.
(3) Represents common shares outstanding at December 31, 2013 as well as shares associated with our Series A convertible preferred stock plus dilutive potential
common shares as used for the calculation of diluted earnings per share in the fourth quarter 2013.
Effective Tax reconciliation:
Year Ended December 31,
2013
Year Ended December 31,
2012
Year Ended December 31,
2011
(in millions)
Pre-Tax
Income
Income Tax
Expense
Effective
Tax Rate
Pre-Tax
Income
Income Tax
Expense
Effective
Tax Rate
Pre-Tax
Income
Income Tax
Expense
Effective
Tax Rate
As Reported(1) $ 1,312 $ 276 21.0% $ 1,332 $ 272 20.4% 1,535 377 24.6%
Adjustments:
Amortization of intangible assets 332 127 328 125 398 150
Loss on early extinguishment of
liability — — — — 33 13
Adjusted $ 1,644 $ 403 24.5% $ 1,660 $ 397 23.9% 1,966 540 27.5%
____________________________
(1) Pre-tax income and income tax expense from continuing operations attributable to Xerox.
57