Xerox 2013 Annual Report Download - page 46
Download and view the complete annual report
Please find page 46 of the 2013 Xerox annual report below. You can navigate through the pages in the report by either clicking on the pages listed below, or by using the keyword search tool below to find specific information within the annual report.-
 1
1 -
2
-
3
-
4
-
5
-
6
-
7
-
8
-
9
-
10
-
11
-
12
-
13
-
14
-
15
-
16
-
17
-
18
-
19
-
20
-
21
-
22
-
23
-
24
-
25
-
26
-
27
-
28
-
29
-
30
-
31
-
32
-
33
-
34
-
35
-
 36
36 -
 37
37 -
 38
38 -
 39
39 -
 40
40 -
 41
41 -
 42
42 -
 43
43 -
 44
44 -
 45
45 -
 46
46 -
 47
47 -
 48
48 -
 49
49 -
 50
50 -
 51
51 -
 52
52 -
 53
53 -
 54
54 -
 55
55 -
 56
56 -
57
-
58
-
59
-
60
-
61
-
62
-
63
-
64
-
65
-
66
-
67
-
68
-
69
-
70
-
71
-
72
-
73
-
74
-
75
-
76
-
77
-
78
-
79
-
80
-
81
-
82
-
83
-
84
-
85
-
86
-
87
-
88
-
89
-
90
-
91
-
92
-
93
-
94
-
95
-
96
-
97
-
98
-
99
-
100
-
101
-
102
-
103
-
104
-
105
-
106
-
107
-
108
-
109
-
110
-
111
-
112
-
113
-
114
-
115
-
116
-
117
-
118
-
119
-
120
-
121
-
122
-
123
-
124
-
125
-
126
-
127
-
128
-
129
-
130
-
131
-
132
-
133
-
134
-
135
-
136
-
137
-
138
-
139
-
140
-
141
-
142
-
143
-
144
-
145
-
146
-
147
-
148
-
149
-
150
-
151
-
152
 |
 |
We expect 2014 revenue in the range of flat to growing 2 percent, excluding the impact of currency. In our Services
business, we expect mid-single digit revenue growth driven by 2013 signings growth, global expansion and
additional acquisitions which increase our service capabilities and global footprint. Services margins are expected to
be in the 10 to 11 percent range as we continue to focus on portfolio mix as well as productivity and cost
improvements. In our Document Technology business, we expect a mid-single digit revenue decline. We expect to
partially offset the projected declines in black-and-white printing by capitalizing on the most advantaged segments
of the market including color, high-end graphic communications and SMB markets. Margins in Document
Technology are expected to be in the 9 to 11 percent range, as we maintain our focus on productivity and cost
improvements in light of the expected decline in revenues.
Currency Impact
To understand the trends in our business, we believe that it is helpful to analyze the impact of changes in the
translation of foreign currencies into U.S. Dollars on revenue and expenses. We refer to this analysis as “currency
impact” or “the impact from currency.” This impact is calculated by translating current period activity in local currency
using the comparable prior year period's currency translation rate. This impact is calculated for all countries where
the functional currency is the local country currency. Revenues and expenses from our developing market countries
(Latin America, Brazil, the Middle East, India, Eurasia and Central-Eastern Europe) are analyzed at actual
exchange rates for all periods presented, since these countries generally have unpredictable currency and
inflationary environments, and our operations in these countries have historically implemented pricing actions to
recover the impact of inflation and devaluation. We do not hedge the translation effect of revenues or expenses
denominated in currencies where the local currency is the functional currency.
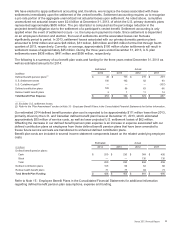
Approximately 32% of our consolidated revenues are derived from operations outside of the United States where
the U.S. Dollar is normally not the functional currency. When compared with the average of the major European
currencies and Canadian Dollar on a revenue-weighted basis, the U.S. Dollar was 1% weaker in 2013 and 5%
stronger in 2012, each compared to the prior year. As a result, the foreign currency translation had a 1% positive
impact on revenue in 2013 and a 1% detrimental impact on revenue in 2012.
Application of Critical Accounting Policies
In preparing our Consolidated Financial Statements and accounting for the underlying transactions and balances,
we apply various accounting policies. Senior management has discussed the development and selection of the
critical accounting policies, estimates and related disclosures included herein with the Audit Committee of the Board
of Directors. We consider the policies discussed below as critical to understanding our Consolidated Financial
Statements, as their application places the most significant demands on management's judgment, since financial
reporting results rely on estimates of the effects of matters that are inherently uncertain. In instances where different
estimates could have reasonably been used, we disclosed the impact of these different estimates on our
operations. In certain instances, like revenue recognition for leases, the accounting rules are prescriptive; therefore,
it would not have been possible to reasonably use different estimates. Changes in assumptions and estimates are
reflected in the period in which they occur. The impact of such changes could be material to our results of
operations and financial condition in any quarterly or annual period.
Specific risks associated with these critical accounting policies are discussed throughout the MD&A, where such
policies affect our reported and expected financial results. For a detailed discussion of the application of these and
other accounting policies, refer to Note 1 - Summary of Significant Accounting Policies in the Consolidated Financial
Statements.
29