Xerox 2013 Annual Report Download - page 105
Download and view the complete annual report
Please find page 105 of the 2013 Xerox annual report below. You can navigate through the pages in the report by either clicking on the pages listed below, or by using the keyword search tool below to find specific information within the annual report.-
 1
1 -
2
-
3
-
4
-
5
-
6
-
7
-
8
-
9
-
10
-
11
-
12
-
13
-
14
-
15
-
16
-
17
-
18
-
19
-
20
-
21
-
22
-
23
-
24
-
25
-
26
-
27
-
28
-
29
-
30
-
31
-
32
-
33
-
34
-
35
-
36
-
37
-
38
-
39
-
40
-
41
-
42
-
43
-
44
-
45
-
46
-
47
-
48
-
49
-
50
-
51
-
52
-
53
-
54
-
55
-
56
-
57
-
58
-
59
-
60
-
61
-
62
-
63
-
64
-
65
-
66
-
67
-
68
-
69
-
70
-
71
-
72
-
73
-
74
-
75
-
76
-
77
-
78
-
79
-
80
-
81
-
82
-
83
-
84
-
85
-
86
-
87
-
88
-
89
-
90
-
91
-
92
-
93
-
94
-
 95
95 -
 96
96 -
 97
97 -
 98
98 -
 99
99 -
 100
100 -
 101
101 -
 102
102 -
 103
103 -
 104
104 -
 105
105 -
 106
106 -
 107
107 -
 108
108 -
 109
109 -
 110
110 -
 111
111 -
 112
112 -
 113
113 -
 114
114 -
 115
115 -
116
-
117
-
118
-
119
-
120
-
121
-
122
-
123
-
124
-
125
-
126
-
127
-
128
-
129
-
130
-
131
-
132
-
133
-
134
-
135
-
136
-
137
-
138
-
139
-
140
-
141
-
142
-
143
-
144
-
145
-
146
-
147
-
148
-
149
-
150
-
151
-
152
 |
 |
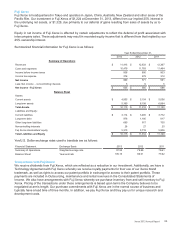
Fuji Xerox
Fuji Xerox is headquartered in Tokyo and operates in Japan, China, Australia, New Zealand and other areas of the
Pacific Rim. Our investment in Fuji Xerox of $1,224 at December 31, 2013, differs from our implied 25% interest in
the underlying net assets, or $1,329, due primarily to our deferral of gains resulting from sales of assets by us to
Fuji Xerox.
Equity in net income of Fuji Xerox is affected by certain adjustments to reflect the deferral of profit associated with
intercompany sales. These adjustments may result in recorded equity income that is different from that implied by our
25% ownership interest.
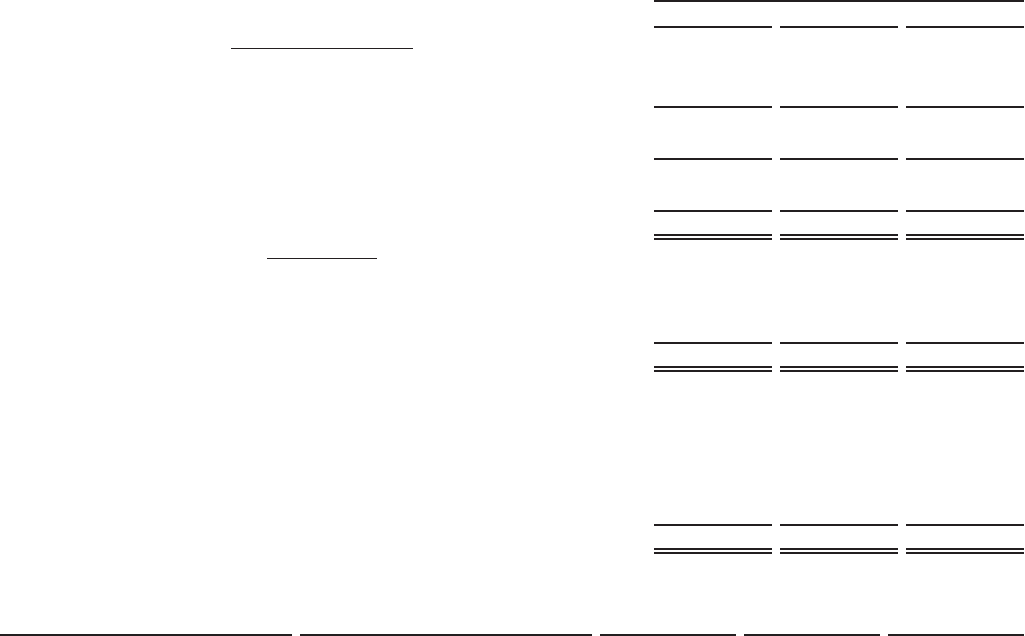
Summarized financial information for Fuji Xerox is as follows:
Year Ended December 31,
2013 2012 2011
Summary of Operations
Revenues $ 11,415 $12,633 $12,367
Costs and expenses 10,479 11,783 11,464
Income before income taxes 936 850 903
Income tax expense 276 279 312
Net Income 660 571 591
Less: Net income - noncontrolling interests 5 6 5
Net Income - Fuji Xerox $655 $565 $586
Balance Sheet
Assets:
Current assets $ 4,955 $5,154 $5,056
Long-term assets 5,160 6,158 6,064
Total Assets $10,115 $11,312 $11,120
Liabilities and Equity:
Current liabilities $ 3,114 $3,465 $3,772
Long-term debt 978 1,185 817
Other long-term liabilities 680 917 700
Noncontrolling interests 28 27 25
Fuji Xerox shareholders' equity 5,315 5,718 5,806
Total Liabilities and Equity $10,115 $11,312 $11,120
Yen/U.S. Dollar exchange rates used to translate are as follows:
Financial Statement Exchange Basis 2013 2012 2011
Summary of Operations Weighted average rate 97.52 79.89 79.61
Balance Sheet Year-end rate 105.15 86.01 77.62
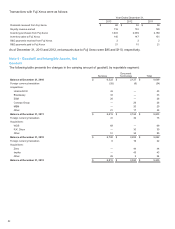
Transactions with Fuji Xerox
We receive dividends from Fuji Xerox, which are reflected as a reduction in our investment. Additionally, we have a
Technology Agreement with Fuji Xerox whereby we receive royalty payments for their use of our Xerox brand
trademark, as well as rights to access our patent portfolio in exchange for access to their patent portfolio. These
payments are included in Outsourcing, maintenance and rental revenues in the Consolidated Statements of
Income. We also have arrangements with Fuji Xerox whereby we purchase inventory from and sell inventory to Fuji
Xerox. Pricing of the transactions under these arrangements is based upon terms the Company believes to be
negotiated at arm's length. Our purchase commitments with Fuji Xerox are in the normal course of business and
typically have a lead time of three months. In addition, we pay Fuji Xerox and they pay us for unique research and
development costs.
Xerox 2013 Annual Report 88